Download
1 / 33
340 likes | 857 Vues
Healthy People 2020 Nutrition and Weight Status. Katelyn Shallow, Shannon Bachtel , Brittany Lobato. NWS-13: Reduce household food insecurity and in doing so reduce hunger. Baseline: 14.6% of households were food insecure in 2008 Target: 6.0%. Background 34.

E N D
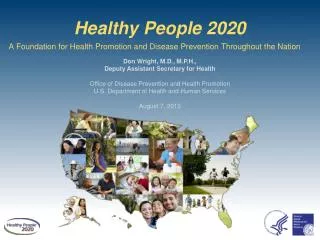
Healthy People 2020Nutrition and Weight Status Katelyn Shallow, Shannon Bachtel, Brittany Lobato
NWS-13: Reduce household food insecurity and in doing so reduce hunger Baseline: 14.6% of households were food insecure in 2008 Target: 6.0%
Background34 • Food security: • “Food security for a household means access by all members at all times to enough food for an active healthy life.” • Food security at minimum includes: • Available and nutritionally adequate, safe foods • Acquisition of food in socially acceptable ways
Background34 • Food insecurity: • “Limited or uncertain availability of nutritionally adequate and safe foods or limited or uncertain ability to acquire acceptable foods in a socially acceptable way.” • Two types of food insecurity: • Low food security • Very low food security
Importance • Food insecurity:34,36 • Rooted in poverty • Impacts ability of families, communities, and countries to develop • Food insecurity can cause:36 • Undernourishment and cognitive development • Stunted growth • Increased susceptibility to illness and disease • Obesity
Measuring Food Insecurity34 • U.S. Household Food Security Survey Module • 18 questions concerning food insecurity • 45,000 households responded • Results: • Food secure • Low food security • Very low food security
Trends in prevalence rates of food insecurity and very low food security in U.S. households, 1995-201134 Source: USDA
NWS-13: National34 Source: USDA
NWS-13: State34, 35 • Washington rates are similar to national average • In 2011, • 1 in 7 families were food insecure (15.4%) • 1 in 16 families had very low food security (6.2%) • WA state is 18th in food insecurity • WA state is 11th in very low food security
NWS-13: Local44,17,48 • In, 2008 • 12% food insecurity in Whatcom County • 1 in 6 people are food insecure Source: Bellingham Food Bank
NWS-13: National & State • Congressional Hunger Center38 • Feeding America: Map the Meal Gap39 • USDA’s Food and Nutrition Service: • Supplemental Nutrition Assistance Program (SNAP)40 • Women, Infants, and Children (WIC) • Child Nutrition Programs41,42 • Senior Farmers’ Market Nutrition Program43
NWS-13: Local • Food banks and pantries44 • Bellingham, Ferndale, Nooksack, etc… • Specifically the Bellingham Food Bank provides: • Food4Tots • Victory Gardens • Milk Money • Food $ense46
NWS-15.1: Increase the contribution of total vegetables to the diets of the population aged 2 years and older Baseline: 0.8 cup equivalent of total vegetables per 1,000 calories was the mean daily intake by persons aged 2 years and older in 2001-2004 Target: 1.1 cup equivalent per 1,000 calories
Obesity trend from 1990-2011 Source: Centers for Disease Control and Prevention
NWS-15.1: National19 • National Nutrition Month • 40th Anniversary • “Eat right, your way, every day” • Food preferences, lifestyle, cultural and ethnic traditions and health concerns all impact individual food choices
NWS-15.1: National20 • USDA MyPlate • May reduce • Obesity • Heart disease • Type 2 diabetes • Cancers • Bone loss Source: United States Department of Agriculture
An Effective Strategy to Increase Vegetable Intake in Adults21 • Vegetable variety on ½ the plate increased consumption of vegetables compared to solely filling ½ of the plate with a single type of vegetable
Together let’s try new foods!22 • Have the child choose a new food as you shop • Cook together • Do a taste test and talk about a new food • Try new foods also, kids copy what they see and hear • Go for at lease “one bite” • Relax, everyone has different food favorites
NWS-15.1: National23 • Farm to School Program • “Nourishing Kids and Community” • Began in 1996 in California and Florida • Goal: • “Strengthen student’s and communities’ knowledge about, and attitudes toward, agriculture, food, nutrition and the environment”
NWS-15.1: State24 Source: UW Center for Public Health Nutrition
NWS-15.1: State28 • Local Farms-Healthy Kids Act • Governor Gregoire signed it into WA law on March 27, 2008 • Established Farm to School Network in WA • Promotes school gardens • Establishes a Farmers Market Technology Program • Establishes three Farm to food Bank pilot programs
NWS-15.1: State29 • Washington State Nutrition and Physical Activity Plan • Last printed in July 2008 • Goal • Empowering residents to make healthy lifestyle choices to prevent obesity and chronic diseases. • Farm to School Network • Farm to Senior Project
NWS-15.1: Local32 • Whatcom County Community Food Assessment • Printed in March 2011 • Indicator of healthy food choices • Currently, only about 30% of adults and between 23% and 33% of children in Washington State consume the daily recommended levels
NWS-15.1: Local33 • Out of 1,483 farms in Whatcom County recognized in the 2007 U.S. Agriculture Census, 18% (273 farms) engage in direct marketing of some kind • That number has grown by 44% in Whatcom County since 2002 (190 farms), far outstripping the Washington State growth rate of 19.7%
NWS-2.2: Increase the proportion of school districts that require schools to make fruits or vegetables available whenever other food is offered or sold • Baseline: 6.6 percent of school districts required schools to make fruits or vegetables available whenever other foods are offered or served in 2006 • Target: 18.6 percent
Importance • School meals may be only source of nutrition for the day13 • Consume 1/2 meals in schools • Growth and development • Help children lead healthy lives • Choices depend on what is visible and accessible
NWS-2.2: National • National School Lunch and School Breakfast Program3 • Target children eligible for free or reduced price lunches • Fresh Fruit and Vegetable Program4 • Provide a variety to children throughout school day
NWS-2.2: National • Farm to School Program8 • Department of Defense Fresh Fruit and Vegetable Program 7 • Healthier US School Challenge14 • Awards have been given to schools in 49 states • As of February 2013, 5,234 schools are certified
NWS-2.2: Key Players • Healthy, Hunger-Free Kids Act11 • USDA updated meal pattern and nutrition standards • 6-cent reimbursement rate increase • Centers for Disease Control and Prevention and Institute of Medicine3 • Nutrition Standards for Foods in Schools: Leading the Way Toward Healthier Youth
NWS-2.2: State • Local Farms - Healthy Kids Act10 • Farm to School Program • Fresh Fruit and Vegetable Program4 • 25 schools in the state participating • Funding for school year 2011/2012 was $3,244,5699
NWS-2.2: Local17 • National School Lunch Program • Farm-to-School Initiative • Enacted in 2009 by Whatcom Community Foundation’s sustainable Whatcom Fund Committee. • Harvest of the Month Program6 • Local produce in one lunch a month • Bellingham Schools serve 4,500-4,600 lunches a day6 • Food $ense
Video • http://join.strength.org/site/PageNavigator/SOS/Breakfast_2013.html
Questions? ? ? ? ? ? ? ? ? ?