Download
1 / 29
530 likes | 1.17k Vues
Chapter 2 – Influence Diagrams. Learn by example Learn vocabulary and grammar. Two k ey elements of decision framing- often not considered. Multiple Objectives Tradeoffs If NOT upfront then when? Multiple stretch goals tradeoffs too late Uncertainty Risk

E N D
Chapter 2 – Influence Diagrams Learn by example Learn vocabulary and grammar
Two key elements of decision framing-often not considered • Multiple Objectives Tradeoffs • If NOT upfront then when? • Multiple stretch goals tradeoffs too late • Uncertainty Risk • If you do NOT ADMIT the existence of uncertainty, you cannot manage it • If you do not QUANTIFY uncertainty, you cannot decide how much to invest to address its impact
Elements of a Decision Frame • Decision(s): Single, Multiple (Simultaneous or Sequential) • Alternatives within each decision • Uncertainty • Criteria--Goals--Values--Objectives = Context Specific • Scope – Time horizon and organizational breadth • Decision Makers & Stakeholders • Constraints • Implicit - restrict range of alternatives • Explicit – mathematical representation (not included here)
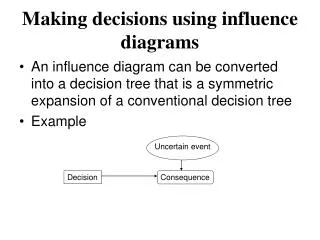
Influence Diagram - Communication • Explicitly note the existence of randomness and uncertainty • Clarify the “main” values or objectives of decision • Emphasize the influence of uncertainty on values • Specify the sequence of decisions
Categories of common objectives. Table 2.1 Min-Costs (variable and investment) Min-Time to complete Max-Profit—NPV, TARR, ROI Min- Risk of not meeting targets Min- Human resources required Min (Max) -Management issues Max-Long-term value Min-Operational issues Max-Performance Sales and/or market share Min-Training requirements
Common uncertainties. Table 2.2 • Time needed to complete task or reach goal • Performance to specifications • Warranty claims and quality control • Resources required • Competitive actions • Cost • Is task doable? • Market demand • Revenue • Throughput–productivity • Will some specific event occur • who will be elected president • pandemic occurs
Framing decision with randomness influence diagrams: Vocabulary Decisions = Rectangles/Boxes = Circles/Ovals = Rounded rectangle = Diamond = Text box with list = Arrow Random Events Values/Goals Calculation Ultimate goal Input/Data Influence
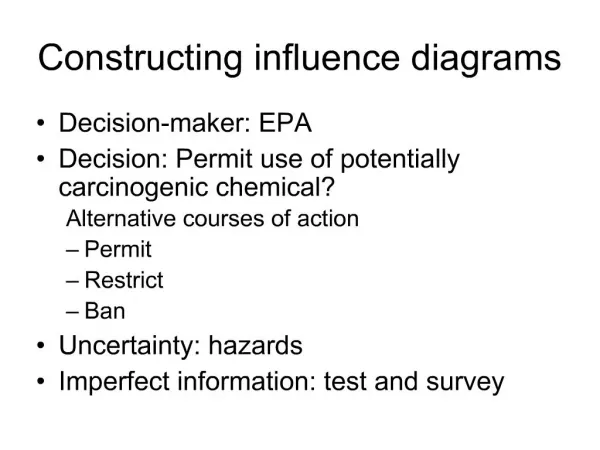
Automation Investment Boss Controls • Manufacture an option to be made • Available to one million purchasers of cars • Uncertain take-rate (percent who buy option) • Deliver the option to (OEMs) at a price of $60. • Two alternatives: differ significantly in investment level automation and variable cost of production
Automation Investment Take rate Profits Automation Investment Volume Variable Cost Investment
Automation Investment: Expanded Volumes Take rate Automation Investment Profits Variable Cost Investment
Percent No Shows Attendees Maximize Goodwill % Yes Responses Number Sent Invitations Invitees Not Attending Figure 2.5: Theater Party Invitations
Percent of No Shows Attendees % Round 1 Yes Maximize Goodwill % Round 2 Yes Round 1 Invitations Round 2 Invitations Invitees Not Attending Figure 2.6: Divide and delay decision - Theater party invitations
Influence Diagram Symbols • Microsoft PowerPoint • Pick appropriate shape: rectangle, oval, rounded rectangle, and diamond. • You may want to have specific fill color for each type of box • Rightclick on shape: “Add text” Can specify size of textand place on more than one line. • Move shapes to appropriate location. • Connect shapes with arrows • Be sure to link to a red dot on each shape enables redesign • Shapes can be copied and text modified.
Influence Diagram Construction • Specify primary decision • Define values and ultimate goal • Identify relevant random variables or events • Specify downstream decisions that need to be analyzed to make primary decision • Add arrows to define relationships • Review layout • List data inputs
Influence DiagramArrows from Random Events: Connectors in PowerPoint Example : Late to Market with New Product Case: A company is considering developing a product that will be ready 3 months after its competitor introduces a similar product. Random Event to Random Event – Conditional probability Random Event to Value – Random event directly influences the VALUE. The value will be uncertain. Competitive Action Sales Volumes Sales Volumes Total Revenue
Influence DiagramArrows from Random Events • Example : Late to Market with New Product • Random event to decision: Random event’s outcome is KNOWN before decision is to be made. • NEVER use an arrow from a circle to a decision to represent the fact that the decision is affected by the random event. This is the most common ERROR. • The arrow shows that the outcome of the chance node is known before the decision is made • Absence of an arrow from the chance node to the decision node does NOT mean that the uncertainty does not influence the decision. • Everything in the diagram affects the decision Competitor’s Price Launch Price
Influence DiagramArrows from decisions Decision to Decision - decision sequence (possibly influence) Decision to Random Event Price influences sales volume Product Features Price Sales Volume Price
Influence DiagramArrows from Random Events • Decision to Value – Decision directly influences value Pricing decision influences total revenue • Indirectly: by affecting sales volume and • Directly: since price sales = Total Revenue Sales Volume Price Total Revenue
Influence Diagram: value to value Total Revenue Net profit Total Cost If Total Revenue and/or Total Cost are influenced by random events then the Net Profit will be an uncertain value. However, once the other two values are known, Net Profit is no longer uncertain.
Late to market with new product:1st lay out elements without arrows Competitor’s Price Sales Volume Develop product Total Revenue Net Profit Product Features Launch Price Total Cost All elements influence the decisions: to develop the product, its features & price Engg. rates Labor rates Throughput
Late to market with new product – Add arrows Competitor’s Price Sales Volume Develop product Total Revenue Net Profit Product Features Launch Price Total Cost Engg. rates Labor rates Throughput All elements influence the decisions: to develop the product, its features & price
Modified Diagram? Competitor’s product performance Economy Sales Volume Competitor’s Price Develop product Total Revenue Product Features Actual Price Launch Price Net Profit Competitor’s features PD Costs Total Cost Engg. rates Labor rates Throughput Manufacturing Cost
What New Objectives Might be Added • Maximize Market Share • Maximize Utilization of plant capacity • Minimize adding to labor workforce (Headcount) • Change overall goal – No longer just net profit – “value to corporation”
Influence Diagram: Is not a Flow Diagram! • All elements of an Influence Diagram are analyzed and influence the decisions even if there are no nodes connected to the decisions • Forecasts of downstream uncertainties affect upstream decisions even without arrows linking the nodes.
Limited Influence Diagram • Mainly uncertainties and only one or two objectives • Project management complete project as planned (within time and budget) • Mainly multiple objectives and limited uncertainty • New car
ALL Elements Represented in the Diagram Influence the Decisions Probabilistic forecasts of sales and the competitor’s price will affect forecasts of revenue and profit. These will influence the decisions: • Whether or not to introduce the product? • With what features? • And at what price?