Download
1 / 17
170 likes | 340 Vues
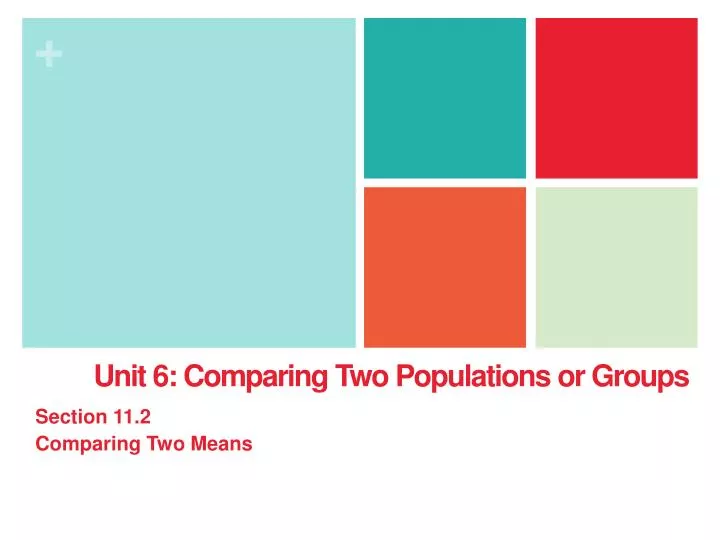
Unit 6: Comparing Two Populations or Groups. Section 11.2 Comparing Two Means. Unit 6 Comparing Two Populations or Groups. 12.2 Comparing Two Proportions 11.2 Comparing Two Means. Section 11.2 Comparing Two Means. Learning Objectives. After this section, you should be able to…

E N D
Unit 6: Comparing Two Populations or Groups Section 11.2 Comparing Two Means
Unit 6Comparing Two Populations or Groups • 12.2 Comparing Two Proportions • 11.2 Comparing Two Means
Section 11.2Comparing Two Means Learning Objectives After this section, you should be able to… • DESCRIBE the characteristics of the sampling distribution of the difference between two sample means • CALCULATE probabilities using the sampling distribution of the difference between two sample means • DETERMINE whether the conditions for performing inference are met • USE two-sample t procedures to compare two means based on summary statistics or raw data • INTERPRET computer output for two-sample t procedures • INTERPRET the results of inference procedures
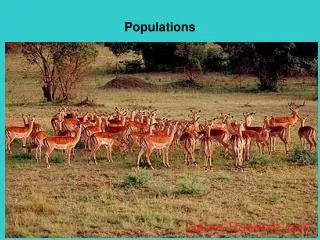
Comparing Two Means • Introduction In the previous section, we developed methods for comparing two proportions. What if we want to compare the mean of some quantitative variable for the individuals in Population 1 and Population 2? Our parameters of interest are the population means µ1and µ2. Once again, the best approach is to take separate random samples from each population and to compare the sample means. Suppose we want to compare the average effectiveness of two treatments in a completely randomized experiment. In this case, the parameters µ1and µ2are the true mean responses for Treatment 1 and Treatment 2, respectively. We use the mean response in the two groups to make the comparison. Here’s a table that summarizes these two situations:
Comparing Two Means • The Sampling Distribution of a Difference Between Two Means To explore the sampling distribution of the difference between two means, let’s start with two Normally distributed populations having known means and standard deviations. Based on information from the U.S. National Health and Nutrition Examination Survey (NHANES), the heights (in inches) of ten-year-old girls follow a Normal distribution N(56.4, 2.7). The heights (in inches) of ten-year-old boys follow a Normal distribution N(55.7, 3.8). Suppose we take independent SRSs of 12 girls and 8 boys of this age and measure their heights.
Comparing Two Means • The Sampling Distribution of a Difference Between Two Means
Comparing Two Means • The Sampling Distribution of a Difference Between Two Means The Sampling Distribution of the Difference Between Sample Means Choose an SRS of size n1from Population 1 with mean µ1and standard deviation σ1 and an independent SRS of size n2from Population 2 with mean µ2and standard deviation σ2.
Comparing Two Means • The Sampling Distribution of a Difference Between Two Means
Comparing Two Means • Example: Who’s Taller at Ten, Boys or Girls? • Based on information from the U.S. National Health and Nutrition Examination Survey (NHANES), the heights (in inches) of ten-year-old girls follow a Normal distribution N(56.4, 2.7). The heights (in inches) of ten-year-old boys follow a Normal distribution N(55.7, 3.8). A researcher takes independent SRSs of 12 girls and 8 boys of this age and measures their heights. After analyzing the data, the researcher reports that the sample mean height of the boys is larger than the sample mean height of the girls.
Comparing Two Means • The Two-Sample t Statistic The two-sample t statistic has approximately a t distribution. We can use technology to determine degrees of freedom OR we can use a conservative approach, using the smaller of n1– 1 and n2– 1 for the degrees of freedom.
Comparing Two Means • Confidence Intervals for µ1 – µ2 Two-Sample tInterval for a Difference Between Means
Comparing Two Means • Big Trees, Small Trees, Short Trees, Tall Trees The Wade Tract Preserve in Georgia is an old-growth forest of longleaf pines that has survived in a relatively undisturbed state for hundreds of years. One question of interest to foresters who study the area is “How do the sizes of longleaf pine trees in the northern and southern halves of the forest compare?” To find out, researchers took random samples of 30 trees from each half and measured the diameter at breast height (DBH) in centimeters. Comparative boxplots of the data and summary statistics from Minitab are shown below. Construct and interpret a 90% confidence interval for the difference in the mean DBH for longleaf pines in the northern and southern halves of the Wade Tract Preserve. State: Our parameters of interest are µ1 = the true mean DBH of all trees in the southern half of the forest and µ2= the true mean DBH of all trees in the northern half of the forest. We want to estimate the difference µ1 - µ2 at a 90% confidence level.
Plan: We should use a two-sample t interval for µ1 – µ2if the conditions are satisfied. • Random The data come from a random samples of 30 trees each from the northern and southern halves of the forest. • Normal The boxplots give us reason to believe that the population distributions of DBH measurements may not be Normal. However, since both sample sizes are at least 30, we are safe using t procedures. • Independent Researchers took independent samples from the northern and southern halves of the forest. Because sampling without replacement was used, there have to be at least 10(30) = 300 trees in each half of the forest. This is pretty safe to assume. Comparing Two Means • Big Trees, Small Trees, Short Trees, Tall Trees Do: Since the conditions are satisfied, we can construct a two-sample t interval for the difference µ1 – µ2. We’ll use the conservative df = 30-1 = 29. Conclude: We are 90% confident that the interval from 3.83 to 17.83 centimeters captures the difference in the actual mean DBH of the southern trees and the actual mean DBH of the northern trees. This interval suggests that the mean diameter of the southern trees is between 3.83 and 17.83 cm larger than the mean diameter of the northern trees.
Section 11.2Comparing Two Means Summary In this section, we learned that… • Choose an SRS of size n1from Population 1 and an independent SRS of size n2from Population 2. The sampling distribution of the difference of sample means has: • Confidence intervals and tests for the difference between the means of two populations or the mean responses to two treatments µ1 – µ2 are based on the difference between the sample means. • If we somehow know the population standard deviations σ1and σ2, we can use a z statistic and the standard Normal distribution to perform probability calculations.
Section 11.2Comparing Two Means Summary • The conditions for two-sample t procedures are:
Section 11.2Comparing Two Means Summary • The level C two-sample t interval for µ1 – µ2 is where t* is the critical value for confidence level C for the t distribution with degrees of freedom from either technology or the conservative approach.
Looking Ahead… Homework Chapter 11, #’s 40c, 41b, 42b, 47c