Download
1 / 35
350 likes | 514 Vues
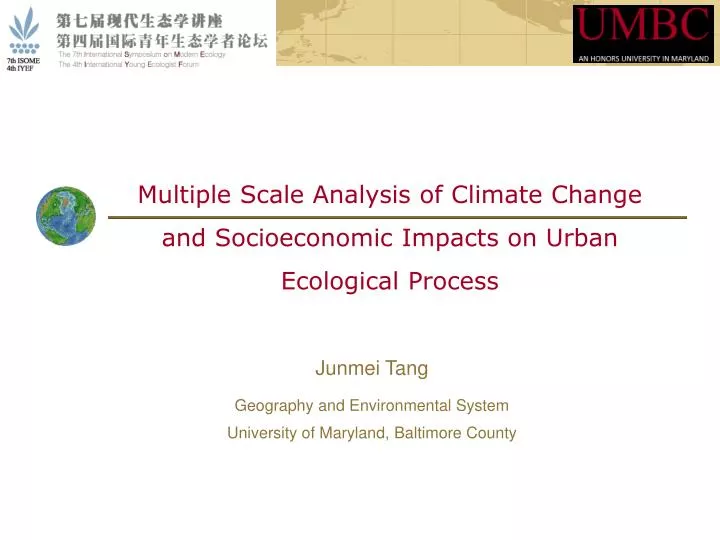
Multiple Scale Analysis of Climate Change and Socioeconomic Impacts on Urban Ecological Process. Junmei Tang Geography and Environmental System University of Maryland, Baltimore County. Outline. Background American 16 cities climate change analysis Eastern shore metropolitan

E N D
Multiple Scale Analysis of Climate Change and Socioeconomic Impacts on Urban Ecological Process Junmei Tang Geography and Environmental System University of Maryland, Baltimore County
Outline • Background • American 16 cities climate change analysis • Eastern shore metropolitan • Baltimore-Washington region • Forest Phenology at tree level • Summary
Hirschhorn am Neckar, Germany Beijing, China Houston, USA Sao Paulo, Brazil Background Global Urbanization 1900 - 14% of humanity lived in urban areas, 2010 – 50.5%
Urbanization History I. Boat/coach era (~1830) Before 1830, harbor cities: New York, Boston, Baltimore, Philadelphia etc; Hudson River. From 1790-1830, population from 4 millions to 13 millions. II. steam engine/railway era (1830-1870) 1830-1870, largest cities: New York, Chicago (concentric pattern). From 1830-1860, population grew to 32 million (immigration).
Urbanization History III. steam engine/steel era (1870-1920) Industrial cities: Boston, New York, Philadelphia, Baltimore, Pittsburg, Cleveland, Detroit, Chicago; city metropolitan From 1870-1920, population grew to 41 million, more cities: Los Angeles, San Francisco, Seattle etc. IV. Auto/Airplane era (1920-1970) Two Characterizes: Suburbanization; Super-metropolitan/megalopolitan urban areas; the most growth area is the South (Los Angeles Atlanta) In 1970, population in suburban is 76 million (37.2%), population grew to 150 million. V. Disaggregate era (after 1970) Conterurbanization, post-industrial/postmodern city Population has the first drop in the metropolitan area.
Data collection and processing 1. National Weather Service (NWS) Cooperative Observer Program (COOP) 2. National NLCD impervious percentage map 3. US Census Bureau
Climate change from 1950-2010 Average temperature in January New York Average temperature in July New York
Spatial Pearson's correlation Spatial Pearson’s Correlation in ArcGIS
Eastern shore metropolitan • Has the longest history in Urbanization. • One of the highest population density area. • Boston-Washington Metropolitan.
Zone statistic at county level Population Density Precipitation Temperature
County level phenology analysis Buckingham, Virginia Lunenburg, Virginia; Philadephia, Pennsylvania; Seneca, New York
County level phenology analysis Correlation: 0.7659; 0.4208 Correlation: 0.7671; 0.3491 Correlation: 0.8318; 0.2853 Correlation: 0.8766; 0.5492
Phenology change in each county Howard County Montgomery County Correlation: 0.8433, 160, 43% Correlation: 0.8465, 159, 45% Prince George County Anne Arundel County Correlation: 0.8350, 157, 42% Correlation: 0.8243, 157, 40%
Ecological function 1990-2010 LAI fPAR
Liriodendron Tulipifera-AKA (Tulip Poplar) • Native to North America. • Limbs may start at 25-30m, up to 50m+. • Fast growing. • April begins flowering.
The First Study Site Big Tree: DBH 75cm; Height: 36.4m; MediamTree: DBH 38.7cm; Height: 26.4m; Understory: American Beech, Musclewood, Sassafras, Northern hackberry; Groundcover: Oak, Beech, Spicebush, Common greenbriar.
The Second Study Site Small Tree: DBH 21.4 cm; Height: 11.3 m; Tiny Tree: DBH 9.5 cm; Height: 5.8 m; Understory: American Beech, Muslewood, Sassafras, Northern hackberry; Groundcover: Oak, Beech, Spicebush, Common greenbriar.
Phenological spectral indicator • Visible Ratios: SRPI = R430/R680 PRI = (R531-R570)/(R531+R570) • Visible/NIR Ratios: NDVI = (R774-R677)/(R774+R677) SIPI = (R800-R450)/(R800+R650) • Red Edge Reflectance-Ratio Indices: Carter = R695/R760 Vogelmann = (R734-R747)/(R715+R726)
Phenological spectral indicator April, 6 August, 30 November, 3 Big Tree, Sunlight
Thanks! Questions & Comments?