Download
1 / 15

E N D
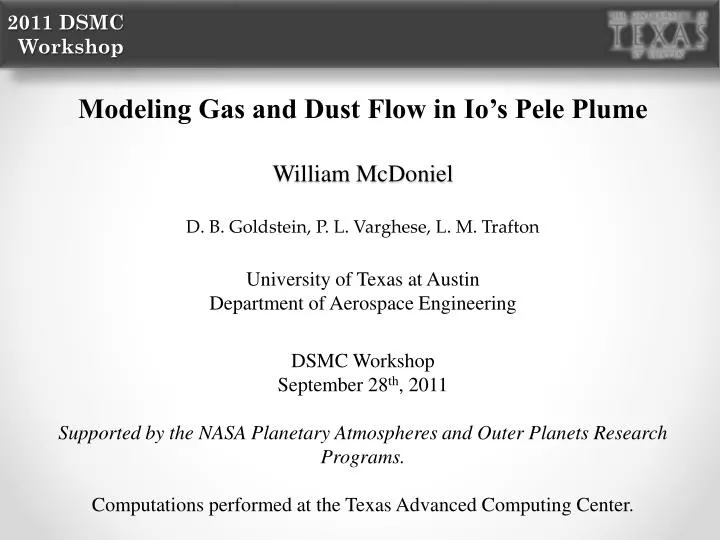
Modeling Gas and Dust Flow in Io’s Pele PlumeWilliam McDonielD. B. Goldstein, P. L. Varghese, L. M. TraftonUniversity of Texas at AustinDepartment of Aerospace EngineeringDSMC Workshop September 28th, 2011Supported by the NASA Planetary Atmospheres and Outer Planets Research Programs.Computations performed at the Texas Advanced Computing Center.
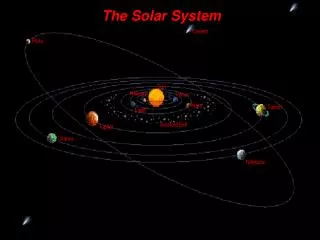
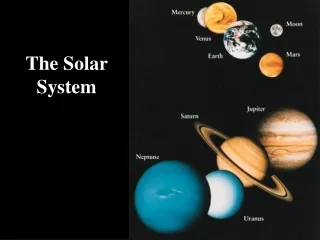
Io’s Plumes Io is the most volcanically active body in the solar system The Pele plume rises to over 300km with a deposition ring ~1200km across Plumes strongly influence the surface and atmosphere Io’s geology is poorly understood
Previous Work • Ju Zhang used Voyager images • Matched plume size and line-of-sight integrated density • Axisymmetric – many observed features couldn’t be simulated
Vent Conditions • Volume reservoirs created beneath Io’s surface • SO2 gas created at 5 × 10¹⁷ mol/m3, 1000 m/s vertical velocity, 650K • Light dust particles are created with very low density at the same velocity and temperature and with diameters uniformly distributed from 30 nm to 2 um • Galileo IR images reveal hot spots (>1000K) • Bob Howell (U. of Wyoming) uses similar images to produce a temperature map • We take bright regions of this temperature map as the sources of the simulated plume.
Simulated Plume Features Rarefied jet expands from the vent Gas falling back on itself creates a self-sustaining canopy shock Vent Canopy Shock Near-vacuum Plume Core • Canopy gas falls away to the side creating a deposition ring • Rotation and Vibration • Radiative cooling • Multi-species with large variation in dust diameter Deposition Ring ~1200km
Scale Variations, Resolution Considerations • Huge scale variations present difficulty for gridding • With DSMC, how important is it to resolve: • The vent geometry? • The gas mean free path? • The boundary geometry must be resolved or else gross inaccuracies arise, especially in dust particles. • This requires cell sizes in the tens of meters near the vent, but gas collisions occur over tens of kilometers further up The vent is divided up into seven regions, and the first 1-2 kilometers above each region is simulated independently of the other regions. 30km
Staging through Multiple Domains • Smaller domains are nested inside of larger domains. • Domain interfaces at 2, 20, and 60 kilometers of altitude • Timestep varies across domains • Three final stages simulated on 360 processors each • ~1 billion total molecules in each domain • ~50 million cells in each domain • ~1 day total wall-clock run-time
Near-field (up to 20 km) Number Densities Mean Free Path 20km altitude slice Strong 3D effects -shocks -converging jets Different sizes (strengths) of sources explain many features
Mid-field (up to 60 km) Number Densities Dust • Gas expands much more rapidly than dust • Gas is now mostly distributed north/south – reversed from the vent’s east/west orientation. • Strong oblique shock has formed between the largest vent region and its neighbor 60km altitude slice
Comparisons in Altitude 20km slice The high-density regions (pink/purple) separate and elongate as the plume expands 60km slice
Far-field Deposition Agreement Ring Shape and Alignment Low-altitude gas jets Gas Dust Dust fans
Constant Altitude Slices (Gas) Number density contours from surface level to 500km in 40 frames.
Far-field Gas Side-view Number density contours starting from 6 o’clock and proceeding counter-clockwise in 40 frames.
Conclusions • We have a very good model of gas and dust flow in Pele which successfully matches observations • The complicated nature of the vent is very important for producing the observed deposition features • Partial dust/gas decoupling is responsible for the different orientations of the gas jets/ring and the dust fans on the surface.