Download
1 / 33
340 likes | 525 Vues
From Pipeline Data to Inspection Planning. Jean Alain MOREAU, Marie PAJOT, Florian FABRE, Yves GIRAUD Integrity Management. TIGF at a glance. In 2005, the Gas & Power business line of TOTAL creates TIGF TIGF operates :

E N D
From Pipeline Data to Inspection Planning Jean Alain MOREAU, Marie PAJOT, Florian FABRE, Yves GIRAUD Integrity Management
TIGF at a glance • In 2005, the Gas & Powerbusiness line of TOTAL creates TIGF • TIGF operates : • 5 000 km of natural gas transmission pipelines (13% national network), • 6 recompression units (100 MW) • 5.4 Gm3 underground storage facilities (22% national capacity). • TIGFdoes not own any gas, but transports and stores it for others gas market actors.
The “AMF” decree dated August 4th, 2006 : • Own a Geographical Information System (GIS) for 2009 with a Technical Data Base for 2011 • VIGIE – Visualisation et Information Géographique des Installations Enterrées (Geographical Visualization and Informationof Underground Installations) • Plan inspections, surveys and mitigations • OGIC-Outil de Gestion de l’Intégrité des Canalisations PIMS -Pipeline Integrity Management System • For TIGF, these are 2 federating projects which shall : • Allow to share data and informations with all users, • Help with decision making
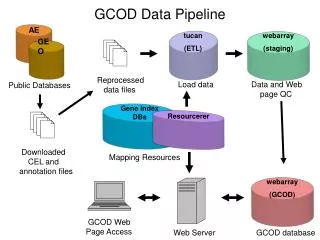
2 different Tools, 1 single Database to meet regulatory compliance Inspection, CP Dalle PODS Technical Data Base Recording & georeferencing data Construction Diameter Pressure Thickness Join, Coating Environment Geographicfeatures, Structure Maximo WorkOrder On the field VIGIE OGIC Geographic Information System Analyse and Display PODS data Threat Analyse Mitigation and Inspection Planning
PODS, the heart of VIGIE and OGIC : • Built on V 4.0.2 • Experience of many pipeline network operators, mainly oil and gas • Independent of the GIS publishers • Exhaustive description of pipeline networks • 3D imaging of events that form or describe the pipeline • Complex work • To collect and indentify all available data • Mainly manual tasks • In few numbers, it’s about : • 70 types of various documents used • 10 000 documents collected from the Archives • 40 000 A4 format scanned • 3 years, 65 000 hours (until 20 persons) • Cost : 2 MEUR for the actual Database • Without the pipeline environment (1 MEUR) • Without the survey, inspection, repairs and CP data (for 2011)
Data analysis Detailed Pipe-segment Files (FIT) Query/ report edition Old data reprocessing methodology Preparation of a technical electronic document management Step1 CMMS Document Management Data Base Scanning and Compilation Technical data Step 2 Data check Step 3: 3D Drawing Step 4 : Feeding BDT Oracle On PODS model O2GB2D Drawing : .dgband 3D Add complementary data (concrete slab, casing, crossing…) Environment DB
Step1 CMMS Document Management Data Base Scanning and Compilation Technical data Step 2 Data analysis Detailed Pipe-segment Files (FIT) Step 3: 3D Drawing Step 4 : Feeding BDT Oracle On PODS model O2GB2D Drawing : .dgb et 3D Add complementary data (concrete slab, casing crossing…) Step by step data reprocessing
2006: Pressure test 2006 : Modification 1992 : Construction Step 1 : Scanning and Compilation
2006: Pressure Test FIT 2006 : Modification 1992 : Construction Step 2 : Data analysis
2D 3D FIT Step 3 : 3D Drawing
What Kind of data in PODS : • Network : • LINES : Pipelines • SITES : Compression station, Valve and Delivery station, Security valve, CP • Data : • Pipe length, weld join, tee, elbow, closure... • Nominal diameter, Wall thickness, Steal grade, coating, MAOP • Dot Class • Crossing (river, road, railroad,...) • Protection (casing, Concrete slab, river weight), • Marker • Building and housing (HI, IGH, ERP, ICPE) • In the future : • Nominal Depth of cover, temperature • Defects, Repairs, Regulatory compliance effects
TIGF PODS Interpretation : PODS 4.0.2 • TIGF used the field “X_Guid” in order to know quickly the link between event and line • TIGF collect data by LINE (ouvragelineaire) (pipeline between 2 valves station) and doesn’t used the SERIES table • => 1 ROUTE = 1 SERIE • When a modification appears on a pipeline, TIGF delete the former pipeline and regenerate the new one (due to the quantity of link between data) • A table allows to manage the pipeline creation, delete and re generation. 16
TIGF PODS Interpretation : PODS 4.0.2 • TIGF created a layer named STRUCTURE : Association of all the eventsin FEATURE_TABLE wich create the complete pipeline • Field FEATURE_TABLE.HYSTORY_TABLE_NAME = ‘STRUCTURE • The accuracy of the drawing of a pipeline in the database could be check trough different ways: • LINE • ROUTE • SERIES • PIPE_SEGMENT • STRUCTURE LAYER : PIPE LENGTH, PIPE JOIN, ELBOW, TEE, …. 17 17
Modification of PODS 4.0.2 : • Try to be faithful to PODS spirit • Modification of existing field • Add New fields 18 18
PODS data organization: Schemabased on ORACLE10g Etape 1 : Saisie et interprétation de la donnée Etape 2 : Vérification et génération des géométries Etape 3 : Paramétrage du SIG Importation par dump Vers un schéma Oracle PODSI PODSI VIGIE GEOMETRY CARTO Génération des géométries Via l’outil SIG (GEOMEDIA) • Récolte des données • Saisie et ordonnancement de la documentation + Numérisation • Saisie des carnets de soudures • Interprétation des données • Intégration des données recoltées dans un espace géoréférencé • Alimentation des caractéristiques des Event-range • Vérification des données • Génération des Géométries • Gestion de projet • Gestion des droits • Gestion de paramètres pour le SIG • Gestion des fonctionnalités spécifiques Localisation : TIGF Action : TIGF Localisation : TIGF Action : ATOS/INTERGRAPH Localisation : Sous-traitant Action : Actavision 19 19
AerialPhotography County Land register Structure Pipelines Topographicmap Data available for all An architecture, from database to end users Etc. Viewer Treatment Users Software Database
The GIS software • INTERGRAPH software • Geomedia Pro + Transportation for administrators (7) • GeomediaWebMap Pro for users (300) • Business functions : • Data Migration to create Geometry • Dynamic Segmentation, 3D modelling • Emergency management, network optimisation • User functions : • Geographic map position, • Looking for a pipeline • Place a pipeline in its environment • Cost :1,3 MEUR
A decision support tool to plan inspection and surveys • PIMS is named OGIC • Based on • A Threat Model (Threat Tree) and a methodology – TAME (BV + ATP) • A Structured database - PODS • Supported by Continuous improvement cycles common to other management systems • Seeking to • Protect the assets • Identify and prioritize pipelines by threat level • Capitalize knowledge • Plan integrity actions (inspection / surveys / mitigations) • Optimize both capital and operating expenditures
Integrity Model : Threat definition Safety involves loss of integrity consequences to Human and to Natural Environment Integrity involves Threats to pipelines Risk (Decrease) Mitigation Measures Surveys and Inspection
Integrity Model : Concept Integrity Cycle Identify threats Record Evaluate probability Carry out mitigations INTEGRITY Calculateloss consequences Plan Classify pipeline segments Calculate level of threat Identify Mitigations
Integrity Model : the Threat tree • Out of 100 threats in the complete model • 45 are already resident in PODS • 18 require specific analysis by GIS • 37 are borrowed from external database
Remaining cycles (PIG) m 0 Depth of cover 1.2 Ω.m 50 Soil resistivity 10 DCVG results Feature OK Defect OK OK 0 Pipe CP -0.85 V Threat level Integrity Model : Threat identification and positioning
Mitigations and “What If” studies • Mitigation proposals 2. The ‘‘what-if’’ function To assess the effect of the various proposed measures to lower the level of threat.
D Level of threat Inspection and survey rules Do IntegrityTasks Operators C P Check Plan Followprogress Maximo/VIGIE Analyse of pipelines and IntegrityTasksSchedule OGIC A Act Refine Integrity Model TAME/OGIC Plan Inspection and survey plan (PIMS approach) • Validation of the model in a global process management Do Plan Check Act
To conclude • VIGIE (GIS) and OGIC (PIMS) projects : • structure and share the information, • make TIGF regulatory compliant, • highlight true threats incurred by the pipelines, • outlay an inspection program based on true threats, • optimize actions means and resources • Nevertheless, • Survey (foot, car, plane ..) is, and remains the main guaranty of the underground networks safety, for civil work carried out by third parties that will never be completely controlled.