Download
1 / 11
110 likes | 310 Vues
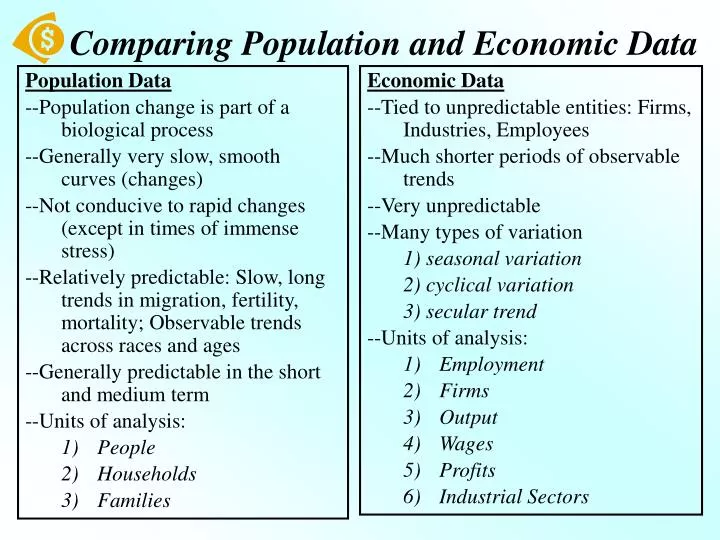
Comparing Population and Economic Data. Population Data --Population change is part of a biological process --Generally very slow, smooth curves (changes) --Not conducive to rapid changes (except in times of immense stress)

E N D
Comparing Population and Economic Data • Population Data • --Population change is part of a biological process • --Generally very slow, smooth curves (changes) • --Not conducive to rapid changes (except in times of immense stress) • --Relatively predictable: Slow, long trends in migration, fertility, mortality; Observable trends across races and ages • --Generally predictable in the short and medium term • --Units of analysis: • People • Households • Families • Economic Data • --Tied to unpredictable entities: Firms, Industries, Employees • --Much shorter periods of observable trends • --Very unpredictable • --Many types of variation • 1) seasonal variation • 2) cyclical variation • 3) secular trend • --Units of analysis: • Employment • Firms • Output • Wages • Profits • Industrial Sectors
General Sources for Economic Data • For an excellent overview of sources for economic data see the report, Socioeconomic Data for Understanding Your Regional Economy: A User’s Guide* available at: http://www.econdata.net/content_usersguide.html Much of the following material is taken from this report. • The Big Three at the national level are: 1) The Census Bureau (Census) http://www.census.gov 2) Bureau of Labor Statistics (BLS)http://www.bls.gov 3) Bureau of Economic Analysis (BEA) http://www.bea.doc.gov *Portions of this document will be required reading in next year’s Forecasting class.
The Census Bureau In addition to a huge amount of data about housing and population, the Census Bureau also gathers and makes available data about business activity in the United States. Business activity data series describe, by industry, characteristics such as: --the aggregate size of the industry (in terms of jobs), --the number of companies and establishments, and --measures of various other aspects of business operation (such as investments in building and equipment) Key business activity data series include: Economic Census (every 5 years)* County Business Patterns (annually)* Annual Survey of Manufactures (annually) *We will discussing these data sources in more detail.
The Bureau of Labor Statistics • BLS, part of the Department of Labor, is the second largest provider of socioeconomic data in the U.S., after the Census Bureau. • BLS provides three types of data series of interest to regional analysts: 1) labor force status of persons (by place of residence), 2) jobs and wages (by place of work), and 3) prices and living conditions • More specifically for this class, the BLS requires states to generate data on jobs and wages through two programs: 1) Covered Employment and Wages (ES-202)*: a quarterly collection of job and wage data from all employers participating in state unemployment insurance (UI) programs 2) Current Employment Statistics (CES)*: through a monthly survey, an estimation of job levels and hourly wages, by industry *We will be discussing these data sources in more detail.
The Bureau of Economic Analysis • BEA is part of the Department of Commerce. Unlike the Census and BLS, BEA produces one big, complex, integrated data set. • The BEA is best understood to be the national economic accountant. BEA reconciles the nation's disparate financial and economic data into a single set of balanced accounts that provides a comprehensive view of the nation’s economic activity. • These accounts model the circular flow of income (as depicted on the next slide). • BEA produces several other data products that reflect its role as the nation’s economic accountant. These are useful to more sophisticated regional data users, and include: 1) Regional Input-Output Modeling System (RIMS II): output, earnings and employment multipliers by industry 2) Gross State Product (GSP): estimates of gross state product and its components for two-digit SIC categories • We will learn more about the RIMS data in a later discussion of Input-Output modeling.
The circular flow of income INJECTIONS Export expenditure (X) FIRMS Investment (I) Government expenditure (G) Consumption of domestically produced goods and services (Cd) Factor payments GOV. BANKS, etc ABROAD Import expenditure (M) Net taxes (T) Net saving (S) WITHDRAWALS HOUSEHOLDS Taken from a Power Point presentation prepared by Pam Perlich at the University of Utah.
National Income and Product Accounts • Many of the key aggregate variables used to describe an economy are presented in a country's National Income and Product Accounts (NIPA). • National income represents the total amount of money that factors of production (firms) earn during the course of a year. • National product, also called national output, represents the market value of all goods and services produced by firms in a country. • Information taken from an overview of NIPA available at: • http://internationalecon.com/v1.0/Finance/ch5/5c010.html
National Income and Product Accounts Individual Product Accounts 1) Personal consumption expenditures (Durables, Non-durables, Services) HOUSEHOLD 2) Gross private domestic investment (Residential fixed investment, Non-residential fixed investment, Business inventories) BUSINESS 3) Net exports of goods and services (exports of goods and services to other countries - imports of goods and services) EXPORTS - IMPORTS 4) Government purchases of goods and services (Durable and non-durable goods purchased by government, Payments for factor services by government) Doesn’t include transfer payments GOVERNMENT Income Accounts 1) Personal income ==> National income ==> Net national product ==> Gross national product 2) Personal income minus personal taxes = Disposable income
The national income and product accounts comprise the principal measures of economic activity in the United States. • Gross National Product (GNP): Gross National Product measures the annual output of goods and services within the national economy • Two main concepts are at the heart of GNP: • 1) GNP as total of all goods and services produced by the economy 2) GNP as total of the income payments made to the owners of the factors of production (firms) used to produce the final output • Annual estimates of GNP are available since 1922, originally produced by the National Bureau of Economic Research - NBER. Quarterly estimates have been available since 1942. • These estimates are now produced by the Bureau of Economic Analysis (BEA). (http://www.bea.doc.gov/) GNP: Gross National Product
National Income and Product Accounts Gross domestic product (GDP): The market value of the goods and services produced by labor and property located in the United States. GDP measures all production within the borders of the country regardless of who owns the factors used in the production process. Gross domestic income (GDI): Measures output as the costs incurred and the incomes earned in the production of GDP. In theory, GDP should equal GDI, but in practice, they differ slightly. Gross national product (GNP): The market value of the goods and services produced by labor and property supplied by U.S. residents. GNP measures all production achieved by domestic factors of production regardless of where that production takes place. Note: The difference between GDP and GNP is net receipts of income from the rest of the world. These net receipts represent income from the goods and services produced abroad using the labor and property supplied by U.S. residents less payments to the rest of the world for the goods and services produced in the United States using the labor and property supplied by foreign residents.
National Income and Product Accounts GDP = C + I + G +EX - IM GDP = Residential Consumption (C) + Business Investment (I) + Government Expenditures (G) + Exports (EX) – Imports (IM) GNP ~ GDI GDP