Download
1 / 1
30 likes | 221 Vues
Comparison of Sensory Profile and Sensory Processing Scale Scores of Children With and Without Autism Sarah Dobbs, MSOT/Student, Claudia Hilton , PhD, OTR/L, FAOTA, Washington University School of Medicine, Program in Occupational Therapy. Purpose

E N D
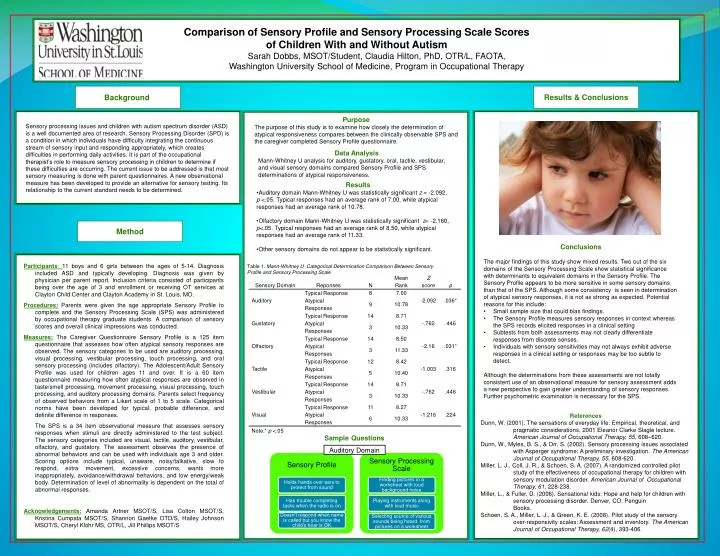
Comparison of Sensory Profile and Sensory Processing Scale Scores of Children With and Without AutismSarah Dobbs, MSOT/Student, Claudia Hilton, PhD, OTR/L, FAOTA, Washington University School of Medicine, Program in Occupational Therapy Purpose The purpose of this study is to examine how closely the determination of atypical responsiveness compares between the clinically observable SPS and the caregiver completed Sensory Profile questionnaire. Sensory processing issues and children with autism spectrum disorder (ASD) is a well documented area of research. Sensory Processing Disorder (SPD) is a condition in which individuals have difficulty integrating the continuous stream of sensory input and responding appropriately, which creates difficulties in performing daily activities. It is part of the occupational therapist’s role to measure sensory processing in children to determine if these difficulties are occurring. The current issue to be addressed is that most sensory measuring is done with parent questionnaires. A new observational measure has been developed to provide an alternative for sensory testing. Its relationship to the current standard needs to be determined. Data Analysis Mann-Whitney U analysis for auditory, gustatory, oral, tactile, vestibular, and visual sensory domains compared Sensory Profile and SPS determinations of atypical responsiveness. Background Results & Conclusions • Results • Auditory domain Mann-Whitney U was statistically significant z = -2.092, • p <.05. Typical responses had an average rank of 7.00, while atypical responses had an average rank of 10.78. • Olfactory domain Mann-Whitney U was statistically significant z= -2.160, p<.05. Typical responses had an average rank of 8.50, while atypical responses had an average rank of 11.33. • Other sensory domains do not appear to be statistically significant. • Conclusions • The major findings of this study show mixed results. Two out of the six domains of the Sensory Processing Scale show statistical significance with determinants to equivalent domains in the Sensory Profile. The Sensory Profile appears to be more sensitive in some sensory domains than that of the SPS. Although some consistency is seen in determination of atypical sensory responses, it is not as strong as expected. Potential reasons for this include: • Small sample size that could bias findings. • The Sensory Profile measures sensory responses in context whereas the SPS records elicited responses in a clinical setting • Subtests from both assessments may not clearly differentiate responses from discrete senses. • Individuals with sensory sensitivities may not always exhibit adverse responses in a clinical setting or responses may be too subtle to detect. • Although the determinations from these assessments are not totally • consistent use of an observational measure for sensory assessment adds • a new perspective to gain greater understanding of sensory responses. • Further psychometric examination is necessary for the SPS. Table 1. Mann-Whitney U Categorical Determination Comparison Between Sensory Profile and Sensory Processing Scale References Dunn, W. (2001). The sensations of everyday life: Empirical, theoretical, and pragmatic considerations, 2001 Eleanor Clarke Slagle lecture. American Journal of Occupational Therapy, 55, 608–620. Dunn, W., Myles, B. S., & Orr, S. (2002). Sensory processing issues associated with Asperger syndrome: A preliminary investigation. The American Journal of Occupational Therapy, 55, 608-620. Miller, L. J., Coll, J. R., & Schoen, S. A. (2007). A randomized controlled pilot study of the effectiveness of occupational therapy for children with sensory modulation disorder. American Journal of Occupational Therapy, 61, 228-238. Miller, L., & Fuller, D. (2006). Sensational kids: Hope and help for children with sensory processing disorder. Denver, CO: Penguin Books. Schoen, S. A., Miller, L. J., & Green, K. E. (2008). Pilot study of the sensory over-responsivity scales: Assessment and inventory. The American Journal of Occupational Therapy, 62(4), 393-406. SampleQuestions Auditory Domain Method Participants: 11 boys and 6 girls between the ages of 5-14. Diagnosis included ASD and typically developing. Diagnosis was given by physician per parent report. Inclusion criteria consisted of participants being over the age of 3 and enrollment or receiving OT services at Clayton Child Center and Clayton Academy in St. Louis, MO. Procedures:Parents were given the age appropriate Sensory Profile to complete and the Sensory Processing Scale (SPS) was administered by occupational therapy graduate students. A comparison of sensory scores and overall clinical impressions was conducted. Measures:The Caregiver Questionnaire Sensory Profile is a 125 item questionnaire that assesses how often atypical sensory responses are observed. The sensory categories to be used are auditory processing, visual processing, vestibular processing, touch processing, and oral sensory processing (includes olfactory). The Adolescent/Adult Sensory Profile was used for children ages 11 and over. It is a 60 item questionnaire measuring how often atypical responses are observed in taste/smell processing, movement processing, visual processing, touch processing, and auditory processing domains. Parents select frequency of observed behaviors from a Likert scale of 1 to 5 scale. Categorical norms have been developed for typical, probable difference, and definite difference in responses. The SPS is a 34 item observational measure that assesses sensory responses when stimuli are directly administered to the test subject. The sensory categories included are visual, tactile, auditory, vestibular, olfactory, and gustatory. The assessment observes the presence of abnormal behaviors and can be used with individuals age 3 and older. Scoring options include typical, unaware, noisy/talkative, slow to respond, extra movement, excessive concerns, wants more inappropriately, avoidance/withdrawal behaviors, and low energy/weak body. Determination of level of abnormality is dependent on the total of abnormal responses. Acknowledgements:Amanda Artner MSOT/S, Lisa Colton MSOT/S, Kristina Cumpata MSOT/S, Shannon Gaetke OTD/S, Hailey Johnson MSOT/S, Cheryl Klohr MS, OTR/L, Jill Phillips MSOT/S