Download
1 / 21
210 likes | 219 Vues
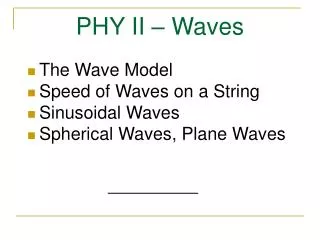
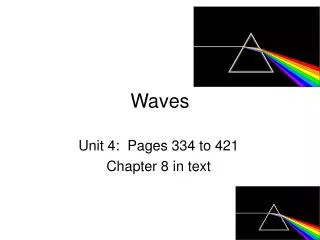
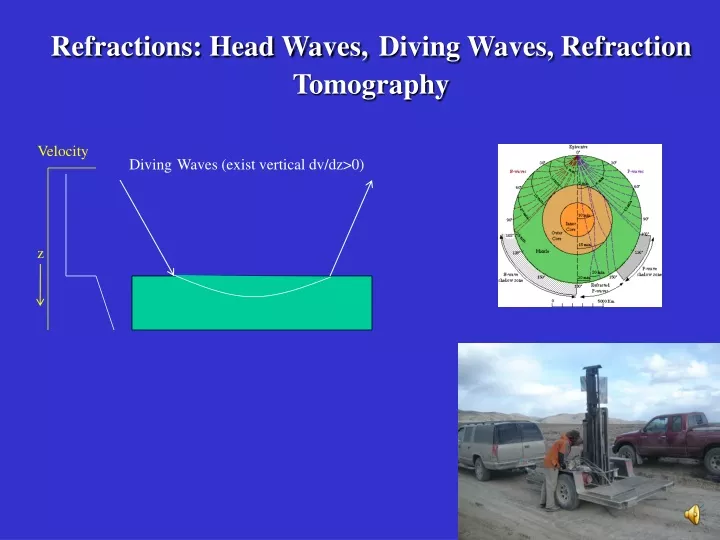
Refractions: Head Waves, Diving Waves, Refraction Tomography. Velocity. Diving Waves (exist vertical dv/dz>0). z. Head Waves vs Diving Waves. Velocity. Head Wave. z. Velocity. Velocity. Velocity. Diving Waves (exist vertical dv/dz>0). Interference Head waves. z. z.

E N D
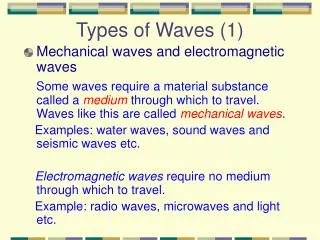
Refractions: Head Waves,Diving Waves, Refraction Tomography Velocity DivingWaves (exist vertical dv/dz>0) z
Head Waves vs Diving Waves Velocity Head Wave z Velocity Velocity Velocity DivingWaves (exist vertical dv/dz>0) Interference Head waves z z
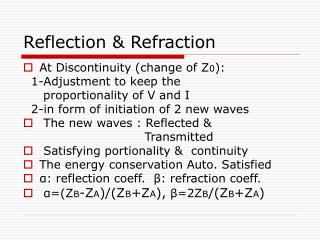
http://arnica.u-strasbg.fr/Sismique/osis.html#FR Diving Waves, linear V(z) grad. and Triplications Velocity x x Direct Wave Refraction Refraction z z t p = sin i(z)/v(z) = 1/vmax Direct Wave A simple velocity gradient produces a refraction that takes a circular path, having a hyperbolic sine (or Error Function) shape in the t-x plot. V(z)=v + kz o Velocity x 3 arrivals at dash x 3 arrivals at dash Direct Wave Direct Wave Reflection z t Head Wave Refraction Reflection p = sin i(z)/v(z) = 1/vmax http://arnica.u-strasbg.fr/Sismique/prog/couche.html
p = sin i(z)/v(z) = 1/vmax P = sinO1/v1 = sinO2/v2=sinO3/v3=1/v4 p = sin i(z)/v(z) = 1/vmax Slowness = inverse apparent Vx Limit of thin horizontal layers v1 v2 v3 v4
http://arnica.u-strasbg.fr/Sismique/osis.html#FR Diving Waves, linear V(z) grad. and Triplications Velocity x x Direct Wave Refraction Refraction z z t p = sin i(z)/v(z) = 1/vmax Direct Wave A simple velocity gradient produces a refraction that takes a circular path, having a hyperbolic sine (or Error Function) shape in the t-x plot. V(z)=v + kz o Velocity x 3 arrivals at dash x 3 arrivals at dash Direct Wave Direct Wave Reflection z t Head Wave Refraction Reflection p = sin i(z)/v(z) = 1/vmax http://arnica.u-strasbg.fr/Sismique/prog/couche.html
http://arnica.u-strasbg.fr/Sismique/osis.html#FR Diving Waves, linear V(z) grad. and Triplications Velocity x 3 arrivals at dash x 3 arrivals at dash Direct Wave Direct Wave Reflection z t d d Head Wave Refraction Reflection p = sin i(z)/v(z) = 1/vmax Synthetics 40 s Gulf California Data 40 s Direct Wave T-dx10 s Direct Wave Refraction Reflection T-dx10 s 80 s 10 deg 40 deg Reflection Refraction 80 s 10 deg 40 deg http://arnica.u-strasbg.fr/Sismique/prog/couche.html
T(x,z) for a linear V(z) grad. Identify with circular arc: Thus: Source-receiver offset: Linear velocity variation: Constancy of apparent horizontal wave-number:
T(x,z) for a linear V(z) grad. Time: One can solve for Plugging Eq.(1) and (3) into Eq.(2), we finally get: From Asymptote:
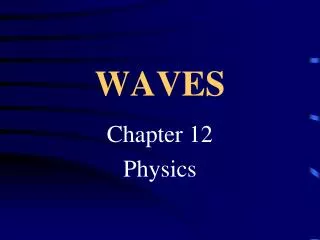
Post-critical reflections Layered Medium & Critical Angle CSG Model 0 0 3 km/s Sea floor Post-critical reflection ray Z (km) Time (s) 4.0 3.5 1.5 km/s 0 6 0 6 X (km) X (km)
http://arnica.u-strasbg.fr/Sismique/osis.html#FR Sahdow Zones:http://www.iris.edu/hq/programs/education_and_outreach/visualizations/tutorial http://www.youtube.com/watch?feature=endscreen&v=JZyYs0tSo4k&NR=1 Shadow Zones and Caustics Shadow Zone II: http://www.youtube.com/watch?v=v_1QcI3BWRk Velocity x F z z Caustic:Phase change results, large Amplitude,ray area zero,surface weak focus, Discontinuity of traveletime slopes x t Shadow Zone F Shadow Zone: An area on Earth's surface where no direct seismic waves from a particular earthquake can be detected. http://arnica.u-strasbg.fr/Sismique/prog/couche.html http://earthquake.usgs.gov/learn/animations/animation.php?flash_title=Shadow+Zone+Flash+Animation&flash_file=shadowzone&flash_width=220&flash_height=300
http://arnica.u-strasbg.fr/Sismique/osis.html#FR Shadow Zones and Caustics Romaowicz Lecture 1 hour: http://earthquake.usgs.gov/learn/animations/animation.php?flash_title=Shadow+Zone+Flash+Animation&flash_file=shadowzone&flash_width=220&flash_height=300 Shadow Zone: An area on Earth's surface where no direct seismic waves from a particular earthquake can be detected. http://arnica.u-strasbg.fr/Sismique/prog/couche.html
Head Wave, Diving Wave, post-Crit. Reflections • Head Waves: Horizontal layered medium Vx = Vrefrac. Slope dx/dt in data = Vrefract. More generally: Refraction tomography. • Post Crit. Reflections: Strong Amplitude More generally: Refraction tomography. Phase Change 3. Diving Waves: PhaseChanges, Triplication Strong Amplitudes, Interfer. Head Waves, Shadow Zones, Caustics http://www.nature.com/nature/journal/v427/n6974/full/nature02231.html
Refraction Tomography t1 = L11/v1 + L12/v2 + L13/v3 + ….+ L1n/vn t2 = L21/v1 + L22/v2 + L23/v3 + ….+ L2n/vn
Refraction Tomography http://www.youtube.com/watch?v=Hrto0nIP8nk&feature=related Cool=falling blobs Cool colors = +v Hot=rising blobs Hotcolors = -v 670 km discontinuity Any planet with a radius over ~1500 km cannot conduct its internal heat away within the age of the universe, so it must convect viscously to release its heat, or it would melt and then convect as a fluid. http://www.youtube.com/watch?NR=1&v=ve7N25R2h4c&feature=endscreen
Bedrock Depths from the Wells 3D Marine: http://www.youtube.com/watch?v=YNkJqJ2VAkQ&feature=related here! Humboldt County Lander County The bedrock is expected to be at depth of several hundred meters from ground surface 677m Buffalo Valley Mine Pershing County #124 680ft(200m) #125 320ft(97m) 3.36km
Buffalo Valley North central Nevada Buffalo Valley Mine Seismic Line Pershing County
Comparison of Tomographic and Seismic Image Tomographic Image m/s 0 Z (m) 300 Seismic Refractor Image Amplitude A B C 0 Z (m) 300 0 2500 X (m)
Interpretation of Tomogram and Seismic Refractors m/s A B C #124 0 #125 320ft (97m) Z (m) 680ft (200m) 845ft (256m) 900 ft (273m) 300 2500 0 X (m) 2000 m (ch48 of Line C) 150 m off from the end