Download
1 / 11
120 likes | 290 Vues
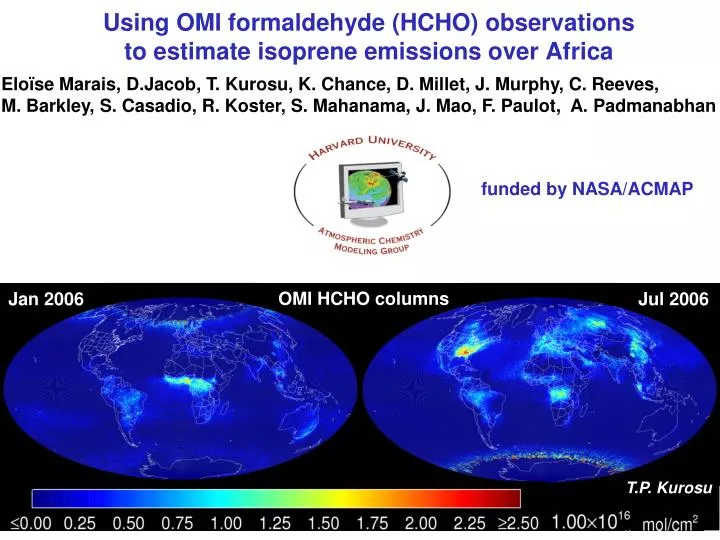
Using OMI formaldehyde (HCHO) observations to estimate isoprene emissions over Africa. Eloïse Marais, D.Jacob , T. Kurosu , K. Chance, D. Millet, J. Murphy, C. Reeves, M. Barkley, S. Casadio , R. Koster , S. Mahanama , J. Mao, F. Paulot , A. Padmanabhan. funded by NASA/ACMAP.

E N D
Using OMI formaldehyde (HCHO) observations to estimate isoprene emissions over Africa Eloïse Marais, D.Jacob, T. Kurosu, K. Chance, D. Millet, J. Murphy, C. Reeves, M. Barkley, S. Casadio, R. Koster, S. Mahanama, J. Mao, F. Paulot, A. Padmanabhan funded by NASA/ACMAP OMI HCHO columns Jan 2006 Jul 2006 and funding from NASA ACMAP T.P. Kurosu
OMI annual mean HCHO slant columns OMI HCHO over Africa (2005-2009) • Formaldehyde (HCHO) is produced by atmospheric oxidation of volatile organic compounds (VOCs) • Observed patterns point to sources from (1) biosphere, (2) open fires, (3) oil and gas industry • Africa accounts for 20% of global biogenic isoprene emissions in MEGAN inventory 1015 molecules cm-2 MODIS leaf area index MODIS fire counts AATSR gas flares
Exclude open fire (and dust) influence using MODIS fire counts, OMI absorbing aerosol optical depth • Exclude oil/gas industry influence using AATSR gas flare product Isolating biogenic HCHO in the OMI data 1015 molecules cm-2
Converting slant to vertical HCHO columns vertical column slant column air mass factor HCHO shape factor (GEOS-Chem) scattering weight = f(albedo, cloud, aerosol) OMI HCHO slant columns biogenic component only OMI HCHO vertical columns biogenic component only MODIS IGBP land cover 1015 molecules cm-2
Relating HCHO columns to isoprene emission volatile organic compound hn (340 nm), OH oxidation VOCi HCHO k ~ 0.5 h-1 yield yi Emission Ei smearing, displacement In absence of horizontal wind, mass balance for HCHO column WHCHO: Local linear relationship between HCHO and E but wind smears this relationship depending on VOC lifetime wrtHCHO production: Isoprene WHCHO a-pinene propane detection limit Distance downwind 100 km VOC source …so that HCHO is mainly sensitive to isoprene emission on ~100 km scale
OMI HCHO (Jun-Aug 2006) GEOS-Chem relationship between HCHO column and isoprene emission Previous work for N. America showed that HCHO columns provide quantitative constraints on isoprene emission OMI-constrained isoprene emission Model slope (2.4 s) agrees with INTEX-A vertical profiles (2.3), PROPHET Michigan site (2.1) Millet et al. [2008]
OH regeneration from isoprene hydroperoxides (Paulot et al., 2009ab) • Isomerization of isoprene peroxy radicals (Peeters et al., 2009, 2010) New developments in isoprene oxidation mechanism Isoprene peroxy radicals Isoprene hydroperoxides
Flight tracks (Jul-Aug 2006) and vegetation index (EVI) Mean vertical profiles (model uses MEGAN isoprene) isoprene HCHO MVK +MACR Model simulation of AMMA aircraft profiles over W. Africa:sensitivity to isoprene oxidation mechanism HO2 NO OH Observations (J. Murphy, C. Reeves, D. Heard) Standard Paulot Peeters Model • Simulation of MVK+MACR, lack of OH titration lends confidence in chemistry • Model HCHO is insensitive to choice of mechanism • Discrepancy with boundary layer HCHO: model or measurement error?
Flight tracks (Jul-Aug 2006) and vegetation index OMI HCHO Latitudinal profiles below 900 hPa Latitudinal profiles along vegetation gradient in AMMA HCHO MVK+MACR Isoprene WIND • OMI HCHO observations closely track the vegetation gradient • AMMA observations indicate no significant lag between isoprene emission and HCHO enhancement
GEOS-Chem local relationship between HCHO column and isoprene emission Annual mean isoprene emission (2006) MEGAN inventory Annual mean column HCHO (2006) Peeters mechanism Scatterplot for African continent (2006) • Daily model values at 2o x 2.5o resolution show strong linear correlation • Slope is insensitive to choice of model isoprene oxidation mechanism, local NOx concentrations • Standard mechanism shows effect of OH titration at high isoprene emissions
Isoprene emission (annual mean, 2006) MEGAN OMI MODIS IGBP land cover OMI-constrained isoprene emissions from Africa:comparison to MEGAN inventory • MEGAN overestimates tropical forest emissions in central Africa, underestimates savanna emissions in southern Africa • overall African emissions overestimated by 60%