Download
1 / 20
200 likes | 322 Vues
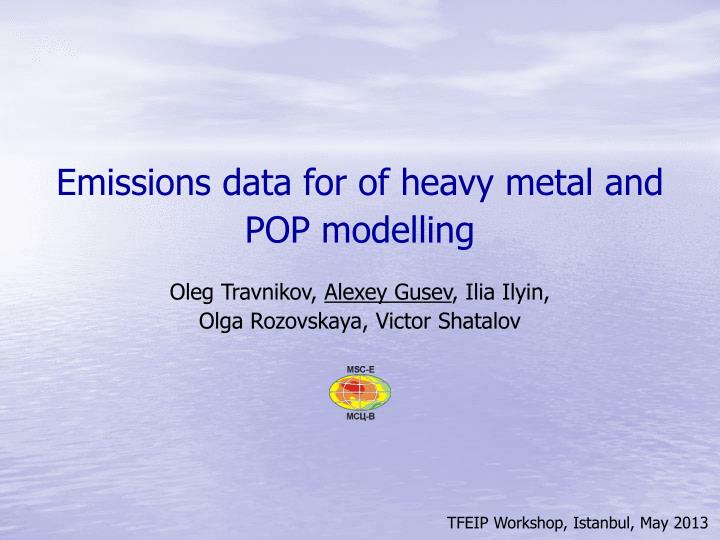
Emissions data for of heavy metal and POP modelling. Oleg Travnikov, Alexey Gusev , Ilia Ilyin, Olga Rozovskaya, Victor Shatalov. Requirements to emissions data for modelling. Spatially resolved data for the whole EMEP region Multi-year emissions for assessment of long-term trends

E N D
Emissions data for of heavy metal and POP modelling Oleg Travnikov, Alexey Gusev, Ilia Ilyin, Olga Rozovskaya, Victor Shatalov
Requirements to emissions data for modelling • Spatially resolved data for the whole EMEP region • Multi-year emissions for assessment of long-term trends • Additional emission parameters: • Chemical speciation and congener composition • Temporal variation of emissions • Height of emission sources • Historical emissions and emissions to other media for multi-media modelling • Emissions in other regions/continents for assessment of intercontinental transport
Completeness of reported HMs emission totals for 1990-2011 EMEP officially reported emissions data • Complete datasets of emission totals are available for 28 countries • There is no national emissions data for 9 EMEP countries
Completeness of reported POPs emission totals for 1990-2011 EMEP officially reported emissions data • Complete datasets of emission totals are available for 22 countries • There is no national emissions data for 8 EMEP countries
United Kingdom France Spain Public electricity and heat production (1A1a) Road transport (1A3) Iron and steel production (2C1) Agriculture (4G) Waste incineration (6C) Other Data completeness: Emission sectors Contribution of major source categories to HCB emissions
EMEP domain t cell-1 y-1 - National totals - TNO totals Spatial distribution and gaps filling Example: Pb anthropogenic emissions in 2011 Emission totals: • Reported data (40 countries) • TNO inventory for 2000 and projections for2010 Gridded data: • Reported grids (27 countries) • TNO inventory for 2000 and projections for2010 • CGEIC global Pb emissions inventory (1°×1°) for 1989 scaled to present
Hg deposition over the globe and in EMEP region (2010) Contribution of regional vs. global sources to HM and POP pollution EMEP sources Global sources Global sources and intercontinental transport
All Hg emissions as Hg0 All emissions as Hg(II) Chemical speciation of emissions: Hg Hg species: Hg0, Hg(II)gas, Hg(II)part Reported emissions: total Hg Expert estimates:Axenfeld et al., 1991; Pacyna et al., 2001 Effect of emission speciation on Hg deposition (2010)
Reporting of PAHs emissions (2011) No data 5 countries (11%) Sum of 4 PAHs 7 countries (14%) Only some PAHs 5 countries (11%) All 4 PAHs 30 countries (64%) Chemical speciation of emissions: PAHs PAH indicator compounds: B[a]P, B[b]F, B[k]F, IP Reported emissions: depends on a country Expert estimates: TNO inventory
Congener composition of PCDD/Fs emissions (EMEP region) Chemical speciation of emissions: PCDD/Fs PCDD/F composition: 17 toxic congeners Reported emissions: total toxicity equivalent Expert estimates: POPCYCLING-Baltic project
Industry and road transport (Schaap et al., 2005) Seasonal variation of BaP air concentration at Kosetice (CZ3) Sectors of BaP emissions in EMEP countries (2010) Observations Observations Model (emission) Model (no variation) 100% 80% 60% Residential heating (Aulinger et al., 2010) 40% Single location in Czech Republic 20% 0% Others Waste incineration Industrial processes Road transport Residential heating Temporal variation of emissions
Contribution of large point sources to Cd deposition Prunéřov II Power Station Emission: 207 t/y (6%) Arcelor-Mittal Ostrava Steel Plant Emission: 859 kg/y (26%) Contribution (%) Emissions from large point sources Note: Contribution of single LPS can exceed 10-20% of Cd total anthropogenic deposition over large areas of the country
Estimates of effective emissions height (Brigg’s approach) Change in annual Pb deposition due to vertical redistribution of emissions Prunéřov II Power Plant Percents h Stack height - 300 m Emissions from large point sources Required parameters: • Stack height • Stack diameter • Gas outflow velocity • Gas temperature
HCB air concentration (2011) HCB global emissions (1945-2010) EMEP EMEP secondary sources HCB accumulation in different media EMEP anthropogenic sources 100% 80% 60% Global anthropogenic sources Global secondary sources 40% Air Soil 20% Ocean 0% 1945 1950 1955 1960 1965 1970 1975 1980 1985 1990 1995 2000 2005 2010 Historical emissions of POPs
PCDD/F air concentration (model vs. observations) PCDD/Fsemissions to land PCDD/Fs emissions in Europe (17 EU countries) Pesticide production Accidental fires to land 85% Waste incineration Waste disposal Pesticide use Other to air 15% [Wenborn et al., 1999] Underestimation by a factor of 5 Emissions of POPs to other media
Influence function for CZ3 October 2007 CZ3 Influence function Pb concentration in air (2007) Adjoint modelling Application of adjoint modelling for evaluation of emission fields Adjoint model: An adjoint model to a CTM provides estimates of spatially resolved influence functions ∂C/∂E for a chosen receptor: • Applied approach: • Model simulation of influence functions for particular receptor • Variational optimization of emission fields to minimize model-measurement discrepancies at selected receptor Košetice (CZ3) • Analysis of the optimized fields from the view point of possible emission uncertainties
What can be improved? • Officially reported data: • Completeness of national totals and gridded emissions • Emissions differentiation by source categories and coverage of all emission sectors • Information on large point sources (emissions, co-ordinates, height, etc.) • Projections of future emissions • Uncertainty estimates or lower/upper limits
What can be improved? • Expert estimates: • Updated inventories for EMEP countries and non-EMEP regions • Global scale emissions data (Hg, HCB) • Chemical speciation or congener composition of emissions (Hg, PCDD/Fs, PAH, PCBs) • Temporal variation of emissions (e.g. by sectors) • Historical emissions (HCB, PCDD/Fs, Hg) • Emissions to other media (soil, water)
Pb concentration in air (2007) October 2007 Optimized (anthrop.) CZ3 Influence function Changes of total Pb emission Optimization coefficients CZ3 Anthrop. emissions Application of adjoint modelling Optimization of HM anthropogenic emissions distribution