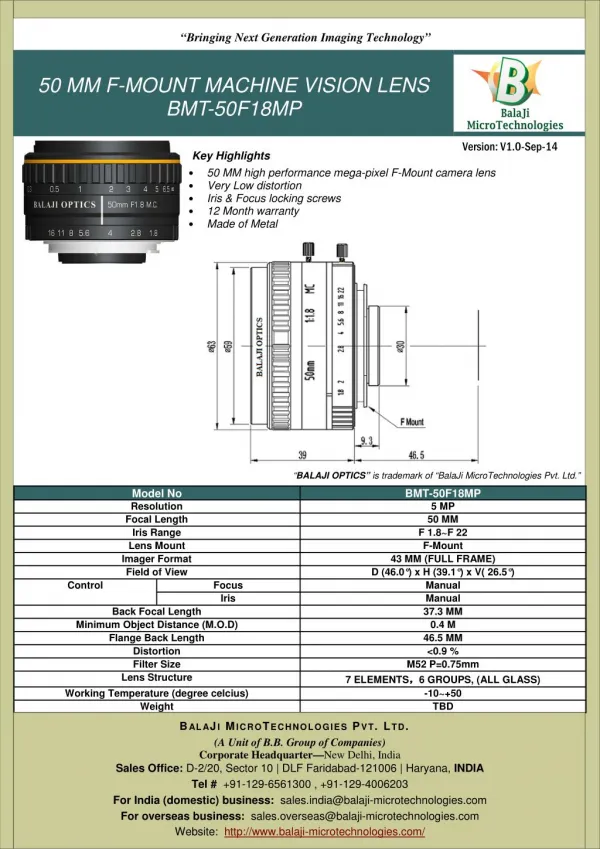
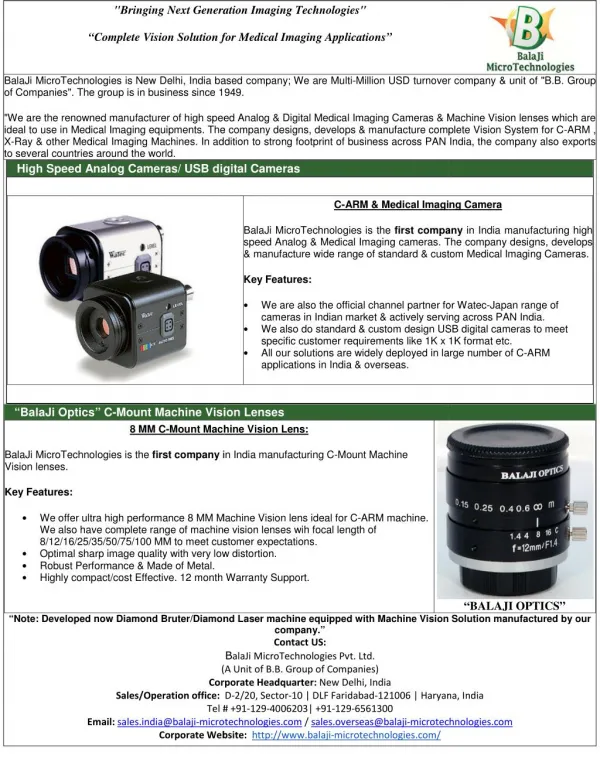
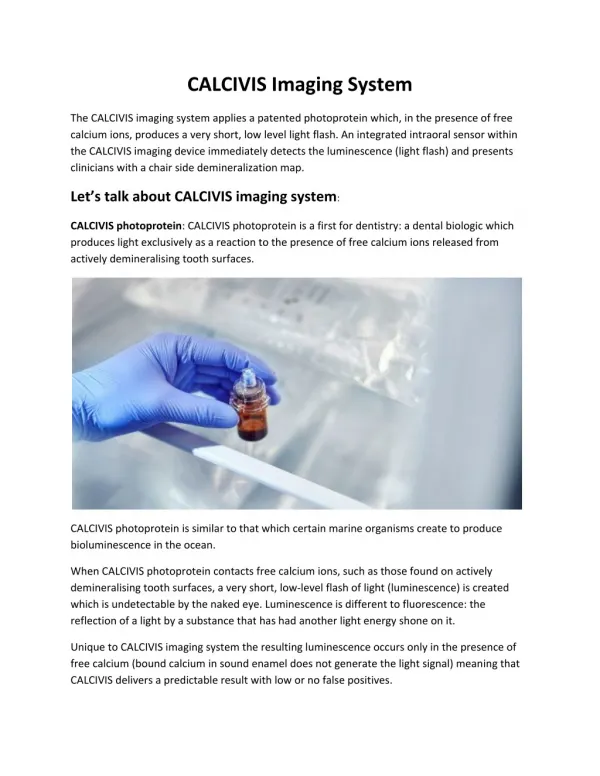
Download
1 / 27
290 likes | 485 Vues
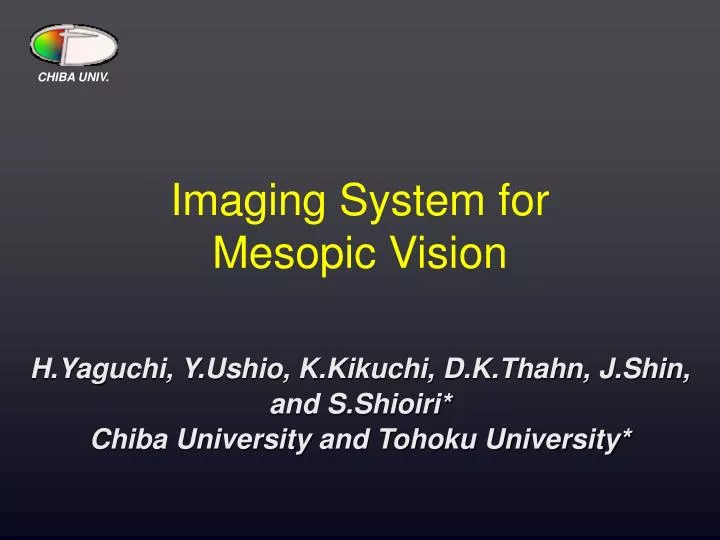
CHIBA UNIV. Imaging System for Mesopic Vision. H.Yaguchi, Y.Ushio, K.Kikuchi, D.K.Thahn, J.Shin, and S.Shioiri* Chiba University and Tohoku University*. Rod Scotopic vision. Cone Photopic vision. Introduction. Human visual system covers Illuminance range from 10 -3 lx to 10 5 lx.

E N D
CHIBA UNIV. Imaging System for Mesopic Vision H.Yaguchi, Y.Ushio, K.Kikuchi, D.K.Thahn, J.Shin, and S.Shioiri* Chiba University and Tohoku University*
Rod Scotopic vision Cone Photopic vision Introduction Human visual system covers Illuminance range from 10-3 lx to 105 lx. Rod and cone Mesopic vision
How does color appearance change with illuminance? To predict color appearance in mesopic vision from the photopic image.
Outline • Experiment of the haploscopic color matching. • A mesopic color appearance model. • A imaging system for mesopic color appearance. • Examples of mesopic color images.
Color appearance in mesopic vision 10 1000 lx 0.01 1000 lx 0.1 1000 lx 1 1000 lx 100 1000 lx •Haploscopic color matching technique 1000 1000 lx
Color appearance in mesopic vision •Stimuli Test field 48 Munsel color chips …chromatic: 45,achromatic: 3 Matching field 21” CRT display (SONY Multiscan G500) Controlled by VSG (15 bits color, Cambridge System) Stimulus size… 1010º
Results: Hue and Chroma • Chroma reduces continuously with decrease of the illuminance level until 0.01 lx. • The loci of matching color on the a*-b* diagram are not straight for many test color chips, indicating that hue shifts with the change in illuminance level.
Results: Chroma • Reddish and yellowish color (Y, YR, R, RP, P):Chroma rapidly decreases from 100 to 1 lx, and constant below 0.1 lx. • Greenish and bluish color (PB, B,BG, G, GY): Chroma rapidly decreases from 1000 to 1 lx, does not change below 1 lx.
Results: Lightness • Reddish and yellowish color: Lightness gradually reduces from 10 to 0.01 lx. • Greenish and bluish color: Minimum lightness is observed around 10 to 1 lx.
Results: Achromatic Lightness • The Stevens effect: Perceived lightness range is reduced with decreasing illuminance.
Correlation between perceived lightness at 0.01 lx and photopic and scotopic luminance Photopic luminance Scotopic luminance
A Color Appearance Model in Mesopic Vision • Luminance channel: L+M • Red/green opponent-color: L-2M • Yellow-blue opponent-color: L+M-S
Luminance as a function of illuminance A(E) = (E)100 ((Lp+Mp) / (Lp+Mp)w)+(E) 78.4(Y ’ / Y ’w) Lp , Mp , Sp: cone outputs at photopic condition Y’: scotopic luminance factor (Lp+Mp)w , Y’w: each output of luminance channels for white (being 100 = Kw) (E), (E):Weighting coefficients for functions of illuminance E
Change of cone- and rod-signal as a function of illuminance A(E) = (E)100 ((Lp+Mp) / (Lp+Mp)w)+(E)78.4(Y ’ / Y ’w)
Red/green- and yellow/blue opponent channel as a function of illuminance Outputs of r/gandy/bchannelsat illuminancelevel of E r/g(E) = l(E)(Lp-2Mp) + (E) Y ’ y/b(E) = m(E)(Lp+Mp-Sp) + (E) Y ’ Lp , Mp , Sp: cone outputs at photopic condition Y’: scotopic luminance factor l (E), (E)and m (E), (E):Weighting coefficients for functions of illuminance E
Comparison between Experimental Results and Prediction: Hue and Chroma
Comparison between Experimental Results and Prediction: Lightness
A Color Appearance Model in Mesopic Vision • Chromatic components decrease with decreasing illuminance. • Hue shifts are predicted by introducing a different process for red/green and yellow/blue opponent-color channel.
Performance of a model • Average E*ab in mesopic range is around 3.
Xp R Yp G Zp B Yp’ To obtain XYZ and Y’ from Digital Camera RGB Predicted Value Measured Value X Camera model Y Minimize error Z Y’
Calibration of Camera Color Sample・・・Macbeth Color Checker and GretagMacbeth ColorCheker Digital Camera・・・Canon,EOS1-Ds ・Image size4064×2704 pixels ・QuantizationRGB 12 bits
R3 G3 B3 R2G R2B ・ ・ ・ BR R G B 1 a1 b1 c1 ・・・・・・・・r1 s1 t1 a2 b2 c2 ・・・・・・・・r2 s2 t2 a3 b3 c3 ・・・・・・・・r3 s3 t3 a4 b4 c4 ・・・・・・・・r4 s4 t4 Xp Yp Zp Yp’ = Camera Model Coefficients a, b,,,t are obtained by the pseudo-inverse method.
Camera performance as a colorimeter Average color difference⊿E*ab =2.23 Maximum color difference ⊿Eab =9.03 Original Macbeth Color Checker Predicted by a Camera Macbeth Color Checker
: 0.998 Coefficient of Correlation : 1.000 Slope Prediction of scotopic luminance Y’ by camera RGB Predicted value Measured value
10(lx) 100(lx) 1(lx) 0.1(lx) 0.01(lx) Examples of mesopic color image Original