Download
1 / 20
200 likes | 314 Vues
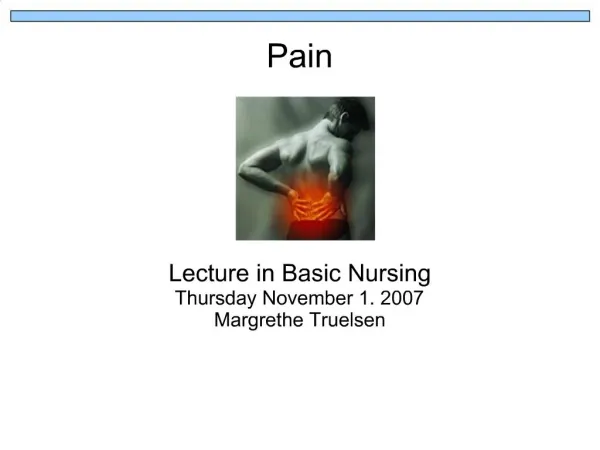
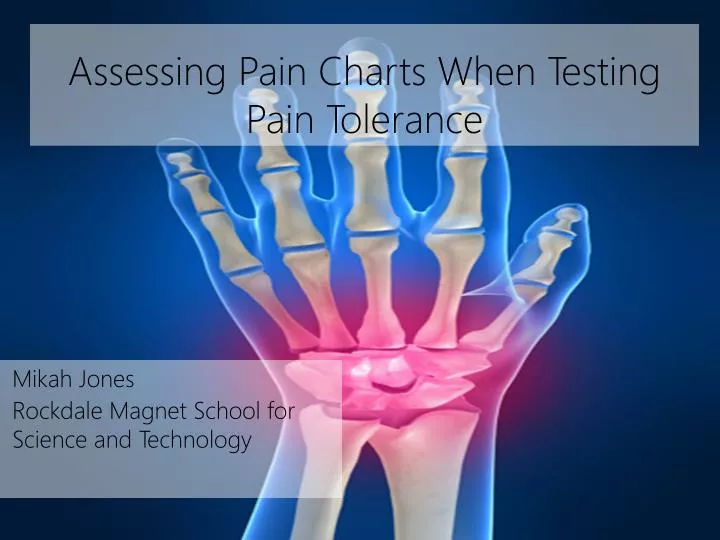
Assessing Pain Charts When Testing Pain Tolerance. Mikah Jones Rockdale Magnet School for Science and Technology. Introduction. Many hospitals use pain charts but there isn’t a pain chart(s) out there that is the best to use or more widely used.

E N D
Assessing Pain Charts When Testing Pain Tolerance Mikah Jones Rockdale Magnet School for Science and Technology
Introduction • Many hospitals use pain charts but there isn’t a pain chart(s) out there that is the best to use or more widely used. • Pain tolerance is associated with pain. Every one individual has a different pain tolerance than another. Race and gender are factors that can play an important role in pain tolernace.
Rationale • If hospitals are using just any pain chart, then that pain chart might not actually be helping the patients there. • It would be helpful to the patient and doctor to have a pain chart that is effective and easy to use and can be used on any type of pain
Purpose • The purpose of this project is to see which pain chart is the easiest to use. • Another purpose of this project is to show the difference in pain tolerance in gender and race groups.
Background • In a study (Ferreira-Valente, Ribeiro, Jensen. February 2011.), it tested 4 Pain charts on how well it can measure pain intensity. • 4 Pain Charts: Visual Analogue Scale (VAS) Numerical Rating Scale (NRS) Verbal Rating Scale (VRS) Faces Pain Scale-Revised (FPS-R) • The participants did 4 20-second trials of the Cold Pressor Test(CPR). The temperatures for the cold water were 1, 3, 5, and 7, degrees Celsius. • Results showed that the Numerical Rating Scale was the most responsive, and was able to detect gender pain intensity differences.
In another study found (Kenneth, Woodrow, Friedman, Sieglaub, Coleen. 1972) they tested the pain tolerance between different age, races, and genders. • Results showed 3 things: 1. Pain Tolerance decreases with age 2. Men tolerate more pain then women 3. Whites tolerate more pain than Asians.
Hypotheses • Main hypothesis: the Numerical Rating Scale will be the theeasiest to use compared to the other pain charts being used. • Sub Hypothesis: A. Females will experience a greater pain tolerance than males • Sub Hypothesis: B. Whites will experience a higher pain tolerance than race groups
Procedures Consent forms are given out Consent forms are returned and start the Cold Pressor Test Container is filled with cold water Data is collected and analyzed Participants put their hands in the water for 1 minute Participants take their hand out and use pain chart
Data Analysis • 38 Participants were used overall • 19 Males, 19 Females • 10 Blacks, 10 Whites, 9 Asians, 9 Hispanics
Average Pain Score Ease of Use
Race Vs. Pain Score Gender Vs. Pain Score
Conclusions • The Numerical Rating Scale was found to be the easiest pain chart to use. The main hypothesis was supported • Sub hypothesis A and B were both rejected • Overall all pain charts were found easy to use • The use of the pain coping chart would not be used in other types of pain since it has a higher average pain score
Acknowledgments • I would like to thank Scott Bolen for helping me with my project and answering any questions that I had along the way. • I would also like to thank the volunteers for being apart of my project.
Literature Cited • Woodrow, K., Friedman, G., Slegelaub, A., Collen, M. (November). Pain Tolerance: Differences According to Age, Sex and Race. Retrieved from http://www.psychosomaticmedicine.org/content/34/6/548.short • Ferreira-Valente,M., Ribeiro,J., Jensen. M. February 2011. Validity of four pain intensity rating scales. Retrieved from http://www.painjournalonline.com/article/S0304-3959(11)00445-3/abstract
Any Questions? Assessing Pain Charts When Testing Pain Tolerance