Download
1 / 30
300 likes | 382 Vues
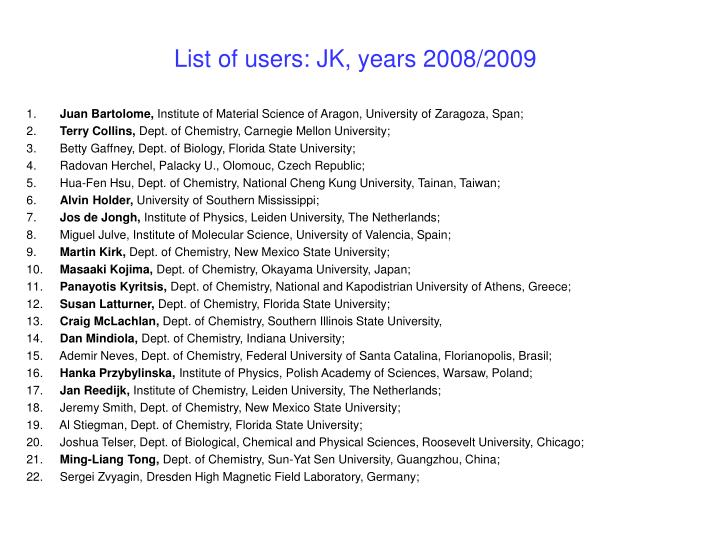
List of users: JK, years 2008/2009. Juan Bartolome, Institute of Material Science of Aragon, University of Zaragoza, Span; Terry Collins, Dept. of Chemistry, Carnegie Mellon University; Betty Gaffney, Dept. of Biology, Florida State University;

E N D
List of users: JK, years 2008/2009 Juan Bartolome, Institute of Material Science of Aragon, University of Zaragoza, Span; Terry Collins, Dept. of Chemistry, Carnegie Mellon University; Betty Gaffney, Dept. of Biology, Florida State University; Radovan Herchel, Palacky U., Olomouc, Czech Republic; Hua-Fen Hsu, Dept. of Chemistry, National Cheng Kung University, Tainan, Taiwan; Alvin Holder, University of Southern Mississippi; Jos de Jongh, Institute of Physics, Leiden University, The Netherlands; Miguel Julve, Institute of Molecular Science, University of Valencia, Spain; Martin Kirk, Dept. of Chemistry, New Mexico State University; Masaaki Kojima, Dept. of Chemistry, Okayama University, Japan; Panayotis Kyritsis, Dept. of Chemistry, National and Kapodistrian University of Athens, Greece; Susan Latturner, Dept. of Chemistry, Florida State University; Craig McLachlan, Dept. of Chemistry, Southern Illinois State University, Dan Mindiola, Dept. of Chemistry, Indiana University; Ademir Neves, Dept. of Chemistry, Federal University of Santa Catalina, Florianopolis, Brasil; Hanka Przybylinska, Institute of Physics, Polish Academy of Sciences, Warsaw, Poland; Jan Reedijk, Institute of Chemistry, Leiden University, The Netherlands; Jeremy Smith, Dept. of Chemistry, New Mexico State University; Al Stiegman, Dept. of Chemistry, Florida State University; Joshua Telser, Dept. of Biological, Chemical and Physical Sciences, Roosevelt University, Chicago; Ming-Liang Tong, Dept. of Chemistry, Sun-Yat Sen University, Guangzhou, China; Sergei Zvyagin, Dresden High Magnetic Field Laboratory, Germany;
List of publications: AO/JK, year 2008 • Aromí, G.; Bouwman, E.; Burzurí, E.; Carbonera, C.; Krzystek, J.; Luis, F.; Schlegel, C.; van Slageren, J.; Tanase, S.; Teat, S. J., Chem. Eur. J., 2008, 14, 11158-11166. • Cizmar, E; Ozerov, M; Ignatchik, O.; Papageorgiou, T. P.; Wosnitza, J.; Zvyagin, S. A.; Krzystek, J.; Zhou, Z.; Landee, C. P.; Landry, B. R.; Turnbull, M. M.; Wikaira, J. L., New J. Phys., 2008, 10, 033008. • Dinse, A.; Ozarowski, A.; Hess,C.; Schomäcker, R. and Dinse, K.P., J. Phys. Chem. C, 112, 17664–1767 • Drabent, K.; Ciunik, Z. and Ozarowski, A.Inorg. Chem.,2008, 47, 3358-3365. • Erdem, E.; Drahus, M.; Eichel, R. A.; Ozarowski, A.; van Tol, J. and Brunel, L. C., Ferroelectrics, 2008, 363, 39-49. • Erdem, E.; Eichel, R. A.; Kungl, H.; Hoffmann, M. J.; Ozarowski, A.; van Tol, J.; Brunel, L. C., IEEE Trans. Ultrasonics Ferroelectrics and Frequency Control, 2008, 55, 1061-1068. • Karadas, F.; Schelter, E. J.; Shatruk, M.; Prosvirin, A. V.; Bacsa, J.; Smirnov, D.; Ozarowski, A.; Krzystek, J.; Telser, J.; Dunbar, K. R., Inorg. Chem.,2008, 47, 2074-2082. • Krzystek, J.; England, J.; Ray, K.; Ozarowski, A.; Smirnov, D.; Que Jr., L.; Telser, J., Inorg. Chem., 2008, 47, 3843-3845. • Makhankova, V. G.; Beznischenko, A.O.; Kokozay, V. N.; Zubatyuk, R. I.; Shishkin, O. V.; Jezierska, J. and Ozarowski, A., Inorg. Chem., 2008, 47, 4554-4563 • Nesterova, O.V.; Petrusenko, S. R.; Kokozay, V .N.; Skelton, B.W.; Jezierska, J.; Linert, W. and Ozarowski, A., Dalton Transactions, 2008, 1431-1436. • Ozarowski, A., Inorg. Chem., 2008, 47, 9760-9762. • Pregelj, M.; Arcon, D.; Zorko, A.; Zaharko, O.; Brunel, L.-C.; van Tol, H.; Ozarowski, A.; Nellutla,S. and Berger, H.,Physica B, 2008, 403, 950. • Szyczewski, A.; Lis, S.; Krzystek, J.; Staninski, K.; Klonkowski, A.; Kruczynski, Z.; Pietraszkiewicz, M. J. Alloys Compd., 2008, 451, 182-185. • Zvyagin, S. A.; Batista, C. D.; Krzystek, J.; Zapf, V. S.; Jaime, M.; Paduan-Filho, A.; Wosnitza, J., Physica B, 2008, 403, 1497-1499.
List of publications: AO/JK, year 2009 • Dinse,K.-P.; van Tol, J.; Ozarowski, A.; Corzilius, B., App. Magn. Reson., accepted. • Martinez-Lillo, J.; Armentano, D.; De Munno, G.; Wernsdorfer, W.; Clemente-Juan, J.; Krzystek, J.; Lloret, F.; Julve, M.; Faus, J., Inorg. Chem.2009, 48, 3027-3038. • Moomaw, E. W.; Angerhofer, A.; Moussatche, P.; Ozarowski, A.; Garcia-Rubio, I. and Richards, N. G. J., Biochemistry, 2009, 48, 6116-6125. • Nesterova, O.V.; Petrusenko, S.R.; Nesterov, D.S.; Kokozay, V.N.; Skelton, B.W.; Jezierska, J.; Linert, W.;Ozarowski, A., New Journal of Chemistry, submitted. • Nieto, I.; Bontchev, R. P.; Ozarowski , A.; Smirnov, D.; Krzystek , J.; Telser , J.; Smith, J. M., Inorg. Chim. Acta, 2009, 362, 4449–4460. • Ozarowski, A.; Szymanska, I. B.; Muziol, T. and Jezierska, J., J. Am. Chem. Soc., 2009, 131, 10279-10292 • Stoll, S.; Gunn, A.; Brynda, M. ; Sughrue, W.; Kohler, A. C.; Ozarowski, A.; Fisher, A. J.; Lagarias, J. C. and Britt, R. D., J. Am. Chem. Soc., 2009, 131, 1986-1995 • Telser, J.; Wu, C.-C.; Chen., K.-Y.; Hsu, H.-F.; Smirnov, D.; Ozarowski, A.; Krzystek, J., J. Inorg. Biochem., 2009, 103, 487-495. • Witwicki, M.; Jezierska, J. and Ozarowski, A., Chem. Phys. Letters, 2009, 473, 160-166. • Witwicki, M.; Jerzykiewicz, M.; Jaszewski, A.; Jezierska, J.; Ozarowski, A., J. Phys. Chem. submitted. • Xavier, F.; Neves, A.; Casellato, A.; Peralta, R.; Bortoluzzi, A.; Szpoganicz, B.; Cardoso Severino, P.; Terenzi, H.; Tomkowicz, Z.; Ostrovsky, S.; Haase, W.; Ozarowski, A.; Krzystek, J.; Telser, J.; Schenk, G., Inorg. Chem., 2009, 48, 7905–7921. • Ye, S.; Neese, F.; Ozarowski, A.; Smirnov , D.; Krzystek, J.; Telser, J.; Liao, J.-H.; Hung, C.-H.; Chu, W.-C.; Tsai, Y.-F; Wang, R.-C.; Chen, K.-Y.; Hsu, H.-F., Inorg. Chem., under review.
JK’s Highlight #1:Synthesis and spectroscopic investigations of four-coordinate nickel complexes supported by a strongly donating scorpionate ligand. (Collaboration with Jeremy Smith, New Mexico State U.) A molecular structure (left) and an ORTEP diagram (right) of HB(tBuIm)3NiBr (“N-confused scorpionate”)
Motivation • Fragment of a larger synthetic work concentrated on the tris(carbene)borates; • Measurement of the donor properties (strength) via various spectroscopic techniques; in this case HFEPR; • Understanding the correlation of electronic and magnetic properties of HS Ni(II) complexes (still in process).
Field-frequency dependence of EPR spectra of HB(tBuIm)3NiBr A multifrequency set of HFEPR spectra of microcrystalline 3 recorded at 4.2 K using optical modulation (i.e., in absorptive mode). The frequencies (in GHz) are given adjacent to each spectrum. 2D (field vs. frequency or energy) map of turning points recognized in the HFEPR spectra of 3 shown in Figure 3. Squares are experimental resonances while curves were generated using best-fitted spin Hamiltonian parameters: S = 1, |D| = 2.49 cm–1, |E| = 0.54 cm–1, gx = 2.22, gy,z = 2.21. Red curves correspond to turning points with B0 || x, blue curves – with B0 || y, and black curves – with B0 || z.
Single-frequency data and the sign of D: HFEPR spectra recorded using magnetic modulation (i.e., in derivative mode) at 222.4 GHz at 5 K (lower black trace) and 30 K (upper black trace) accompanied by powder-pattern simulations using the following spin Hamiltonian parameters: S = 1, |D| = 2.52, |E| = 0.63 cm–1, giso = 2.22. Red traces were calculated using positive values of the zfs parameters, while blue traces – using negative values. The sharp peak at g ~ 2.2 (~7.2 T) in the experimental spectra is the so-called “double-quantum transition”, which is not simulated.
Unexpected result: hyperfine structure The hyperfine structure superimposed on the Bmin turning point in the EPR spectra of 3 recorded using magnetic modulation at 30 K and various frequencies, as indicated. Zero on the magnetic field scale corresponds to 1.004 T at 112 GHz, 3.315 T at 202 GHz, 4.730 T at 305 GHz, 6.870 T at 432 GHz, and 10.012 T at 624 GHz. Experimental HFEPR spectrum of 3 recorded using magnetic modulation at 30 K and at 432 GHz (black trace) along with a simulation (red trace), generated as the sum of three individual spectra with slightly varying giso values: 2.230, 2.215, 2.200. Each simulation otherwise uses the following identical parameter set: S = 1, D = +2.49 cm-1, E = +0.54 cm-1; isotropic Gaussian linewidth (hwhh), 1.2 GHz; Aiso(81Br) = 1.50 GHz (Aiso(79Br) = 1.39 GHz), P||(81Br) = (3/2)Pz = 33 MHz (P||(79Br) = 40 MHz). Simulations were calculated for each Br isotope and then summed in the abundance ratio.
Results/Discussion • The HB(tBuIm)ligand is a stronger σ-donor than the “regular” scorpionate; • The same ligand has also π-donating properties; • LFT calculations semi-quantitatively successful in correlating electronic and magnetic properties; • LFT problematic in determining the sign of D; • This is probably due to spin delocalization to a heavy atom (Br) as proved by the observed hyperfine structure due to Br isotopes. Published in: Nieto, I.; Bontchev, R. P.; Ozarowski , A.; Smirnov, D.; Krzystek , J.; Telser , J.; Smith, J. M., Inorg. Chim. Acta, 2009, 362, 4449–4460.
JK’s Highlight #2:Aminocarboxylate Complexes of Vanadium(III): Electronic Structure Investigation by HFEPR Spectroscopy (Collaboration with Hua-Fen Hsu, National Cheng Kung U. Taiwan) Complexes investigated in this study (as powders and aqueous solutions)
Motivation • Aminocarboxylate complexes of vanadium(III) are of interest as models for biologically and medicinally relevant forms of this interesting and somewhat neglected ion; • Obtaining EPR spectra from this ‘EPR-silent’ ion, particularly in aqueous solutions; • Characterize magnetic properties via spin Hamiltonian formalism; • Characterize electronic structural properties combining electronic spectra and magnetic response using LFT;
Typical FFD in solid form (Na[V(trdta)]·3H2O) Field vs. frequency map of EPR resonances recorded at 5 K for solid Na[V(trdta)]·3H2O. Red squares represent experimental resonances attributed to the dominant triplet state of somewhat larger zfs parameters than that represented by the blue circles. Red curves were simulated using S = 1, |D| = 5.60 cm–1, |E| = 0.85 cm–1, giso = 1.95, and blue curves using S = 1, |D| = 5.15 cm–1, |E| = 0.23 cm–1, giso = 1.95, with dotted lines represent turning points with B0 || x, dashed lines with B0 || y and solid lines with B0 || z. Black crosses at low frequencies/fields represent resonances that could not be attributed to either triplet state; their appearance suggests a presence of yet another species characterized by a smaller zfs. Green triangles are resonances originating from a V(IV) impurity as proved by the green line, which is a simulation using S = 1/2 and giso = 1.95.
Single-frequency spectra of aqueous [V(trdta)]- HFEPR spectrum of aqueous [V(trdta)]- recorded at 305 GHz and 20 K (solid trace) together with a simulation (dashed trace) assuming an ideal powder pattern, which is the sum of equal amounts of three individual triplet species. Spin Hamiltonian parameters used in the simulations: all S = 1; one species with: D = +0.68 cm–1, E = 0, gx,y = 1.98, gz = 1.95, 50 mT isotropic single-crystal linewidth; one species with D = +0.87 cm–1, E = 0, gx,y = 1.98, gz = 1.95, 50 mT linewidth; one species with: D = +2.35 cm–1, E = 0, giso = 1.95, 200 mT linewidth.
Aqueous HFEPR spectrum of [V(edta)(H2O)]- HFEPR spectrum of aqueous [V(edta)(H2O)]- recorded at 218 GHz and 20 K. Central (solid) trace: experiment; upper dashed trace: simulation using parameters: S = 1, D = -2.01 cm–1; E = 0, giso = 1.95; lower dashed trace: simulation using the same value but a positive sign of D. Isotropic single-crystal linewidth used in the simulations for the ΔMS = 1 transitions: 200 mT; for the ΔMS = 2 transition: 50 mT. The intensities of the simulated spectra are scaled so as to match exactly the experimental turning point at 6.8 T, demonstrating that the intensities of the features at 5.9, 9 and 10 T are matched by the simulation only for D > 0. The peak near 8 T originates from a trace amount of V(IV)
Comparison of HFEPR and X-band Main figure: [V(edta)(H2O)]- in aqueous solution shows spectra even at X-band (at 9.7 GHz and 20 K; upper, solid trace is experiment; lower, dashed trace is simulation using the spin Hamiltonian parameters obtained from HFEPR experiments, with the single-crystal linewidth of 100 mT for the perpendicular turning point, and 25 mT for the parallel one; these linewidths are of the same order of magnitude as those required at high frequencies). The group of resonances centered on 350 mT belongs to the well-known hyperfine pattern of the VO2+ ion. The single narrow line at ca. 180 mT, indicated by the asterisk, originates from the dielectric resonator used in this experiment. Inset: the origin of the 218 GHz, and 9.7 GHz resonances in the 2D field/frequency representation such as in Figure 1 (solid lines are with the field parallel; dashed lines with the field perpendicular to the molecular axes). The field range of the HFEPR experiment (see Figure 3) is represented by the vertical dotted line, while the circle indicates the X-band EPR conditions used here.
Results/discussion • First ever successful EPR detection of V(III) in aqueous solution; • In combination with very insightful previous studies of the electronic absorption which provided ligand-field parameters, it has been possible to describe the electronic structure of V(III) in [V(trdta)]- and [V(edta)(H2O)]- ; • Qualitative conclusions as to the relationship between coordination and optical and magnetic properties: 6-coordinate V(III) complexes with O,N donor atoms show no electronic absorption band in the NIR region, and exhibit relatively large magnitude zfs (D 5 cm-1), while analogous 7-coordinate complexes do have a NIR absorption band and show relatively small magnitude zfs (D < 2 cm-1). Published in: Telser, J.; Wu, C.-C.; Chen., K.-Y.; Hsu, H.-F.; Smirnov, D.; Ozarowski, A.; Krzystek, J., J. Inorg. Biochem., 2009, 103, 487-495.
AO’s Highlight #1:Structure of the biliverdin radical intermediate in PcyA identified by high-field EPR Motivation: The cyanobacteria employ the pigment phycocyanobilin (PCB) in light-energy conversion (photosynthesis). PCB is produced by the enzyme phycocyanobilin : ferredoxin oxidoreductase (PcyA) from biliverdin (BV). The mechanism of PcyA's catalysis is poorly understood. With HFEPR, the nature of the radical intermediate can be determined, thus helping to elucidate the reaction mechanism. (Collaboration with David Britt, UC Davis)
Reaction mechanism radical intermediate radical intermediate exo endo 2H+, 2e- 2H+, 2e- biliverdin IXα (BV) 181,182-dihydrobiliverdin (DHBV) 3Z/3E-phycocyanobilin (PCB)
EPR spectra (406 GHz) Radical intermediates of various mutants of the enzyme were obtained by freeze-quenching, and EPR spectra at 406.4 GHz were measured and the g tensors were obtained. The g tensor of a radical, characterized by three values gx, gy, and gz, is a sensitive probe for the protonation state of the radical. It can be predicted theoretically by density functional theory (DFT) calculations based on the X-ray crystal structure of the enzyme-substrate complex. There are six possible protonation sites in biliverdin. The g tensors of all 42 possible protonation states were computed.
Conclusions • Comparison with the experimental g tensor reveals that the biliverdin radical is in a bis-lactim form, protonated at the two carbonyl oxygens. • The resolution power of EPR has been spectacularly demonstrated. Published in: Stoll, S.; Gunn, A.; Brynda, M. ; Sughrue, W.; Kohler, A. C.; Ozarowski, A.; Fisher, A. J.; Lagarias, J. C. and Britt, R. D., J. Am. Chem. Soc., 2009, 131, 1986-1995
AO’s Highlight #2HFEPR and Magnetic Studies on (novel) Tetrameric and Dimeric Quinoline Adducts of Copper Trifluoroacetate (some induced by Florida air) An unusually rich source of polynuclear complexes was discovered while investigating the quinoline adducts of copper(II) trifluoroacetate. Two previously unknown green benzene and toluene solvates containing a μ4-oxo core, Cu4O(CF3COO)6(quin)4 , were synthesized and found to be ferromagnetic with a ground state S=2. When exposed to Florida air,* they convert irreversibly to a blue complex of unknown structure which is antiferromagnetic and exhibits triplet state EPR spectra. Magnetic susceptibility measurements revealed that the blue complex was also tetrameric. Moreover, exposure of a previously known dimeric complex Cu2(CF3COO)4(quin)2 to humid air resulted in a reversible formation of yet another tetrameric system, {[Cu2(OH)(CF3COO)4(quin)]-(quinH+)}2 in which two quinoline molecules are coordinated to copper, while another two are protonated and play a role of cations. Published in: Ozarowski, A.; Szymanska, I. B.; Muziol, T. and Jezierska, J., J. Am. Chem. Soc., 2009, 131, 10279-10292
2.5 3 2.0 2a 1.5 m eff per 1 Cu, B.M. 2 1.0 0.5 Temperature, K 0.0 0 100 200 300 2a 2 3 Results • Structures and magnetic properties: 2: Green dimer Cu2(CF3COO)4(quin)2 2a: Blue Tetramer {[Cu2(OH)(CF3COO)4(quin)]-(quinH+)}2 3: Green Tetramer Cu4O(CF3COO)6(quin)4
The green benzene and toluene solvates containing a m4-oxo core, Cu4O(CF3COO)6(quin)4 are ferromagnetic with a ground state S=2. The EPR spectra were analyzed in terms of the spin Hamiltonian H = mBB·g·S + D{Sz2-S(S+1)/3} + E(Sx2- Sy2) + B40O40 + B42O42 + B44O44 A blue species formed from the green tetramers exhibits triplet state (S=1) EPR spectra. EPR spectra of the green tetramers (top, 324 GHz, 10K) and of the blue tetramer (bottom) A Hamiltonian H=J1(S1S2+S3S4) + J2(S1S3+S1S4+S2S3+S2S4)was used to describe the magnetic properties of the green and blue tetramers. EPR parameters had to be taken into account to reproduce magnetic susceptibility of the ferromagnetic tetramers at the lowest temperatures. J1 = -100 cm-1, J2 = -39 cm-1 were found for the green tetramers, while J1 = J2= +88 cm-1 was determined for the blue tetramer. The EPR spectrum observed for the latter species comes from an excited S=1 state. Red solid lines in the figure to the right were simulated with these parameters. The copper coordination and the system of bridges in the green tetramers Magnetic moments of the green and blue tetramers
Green Dimer Cu2(CF3COO)4(quin)2 80 K, 406.4 GHz Simulated with: gx=gy = 2.084, gz= 2.412 D = - 0.433 cm-1, E = 0 11.5 12.0 12.5 13.0 13.5 14.0 The blue complex [Cu4(OH)2(CF3COO)8(quin)2]2-(quinH+)2 (right) formed on Florida air from the previously known solid dimeric [Cu(CF3COO)2∙(quin)]2 (left), is antiferromagnetic and shows no EPR spectrum at any frequency and temperature. ‘Broken symmetry’ DFT calculations were performed to estimate the exchange integrals in all three tetranuclear complexes of known structure, showing surprisingly good agreement with experimental results. Blue circles: magnetic susceptibility of [Cu4(OH)2(CF3COO)8(quin)2]2-(quinH+)2The red line was calculated with J1=0, J2=81cm-1, g=2.17. Green circles are the literature data for the green dimer [Cu(CF3COO)2∙(quin)]2.The solid line was calculated for a dimer with J=310 cm-1 and g=2.27 (literature data). Green Dimer Blue Tetramer
Development of a New Mössbauer Facility at the NHMFL A Mössbauer instrument equipped with a 57Co source, suitable for 57Fe-containing samples was installed several months ago and the low-temperature extension has been added recently. Some practical experiments have already been performed (A. Ozarowski’s UCGP grant). Some iron(II) complexes of ligands of intermediate strength are paramagnetic at the room temperature (S=2) but undergo an abrupt ‘spin crossover’ transition when the temperature is lowered (105 K in this particular case). The resulting diamagnetic state (S=0) is stable down to the lowest temperatures. However, when a diamagnetic sample kept at 4.2 K was irradiated with green light, a so-called Light-Induced Excited Spin State Trapping process (LIESST) occurred and the sample was converted to the paramagnetic state (S=2), which is then stable for unlimited time below 50K. In this way, the Mössbauer spectra of both the diamagnetic state (red line) and paramagnetic state (green line) were recorded at 4.2 K. The sample was provided by an external user (Dr. K. Drabent, Wroclaw University). The nuclear processes occurring in a Mössbauer source. The Mössbauer effect relies on the 14.4 keV gamma radiation (red arrow)
Development of an FDMR spectrometer at NHMFL(Frequency Domain Magnetic Resonance) FDRMS: an alternative way of doing EPR: sweeping frequency instead of field. (A) [Fe(H2O)6](ClO4)2 (B) (NH4)2[Fe(H2O)6](SO4)2, Field domain Frequency domain
Experimental FDMRS setup Exp. setup in Stuttgart, Germany (Dressel) The BWO range (needs updating)
Practical need for FDMRS: Powder 224 GHz spectrum of Ni(II)(tacn)2(ClO4)2 at T = 10 K.
Practical need for FDMRS: |D| or |D+E| ? Powder 98 GHz spectrum of Ni(II)(tacn)2(ClO4)2 at T = 10 K.
Practical need for FDMRS: Powder 224 GHz spectrum + simulation of Ni(II)(tacn)2(ClO4)2 at T = 10 K. Spin Hamiltonian para. S = 1; |D| = 3.2; |E| = 0.32 T; giso = 2.15.