Download
1 / 1
10 likes | 139 Vues
Analysis of WRF Model Ensemble Forecast Skill for 80 m Winds over Iowa. Shannon L. Rabideau, Adam J. Deppe. Mentor: Eugene S. Takle Department of Geological and Atmospheric Sciences, Iowa State University. Introduction

E N D
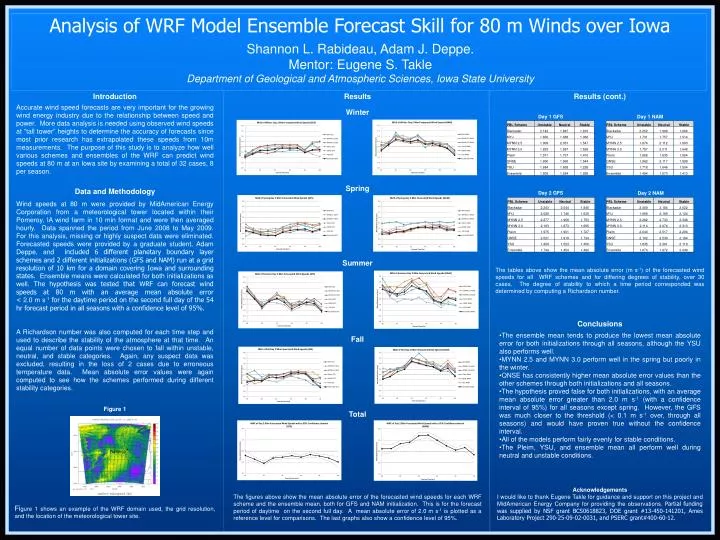
Analysis of WRF Model Ensemble Forecast Skill for 80 m Winds over Iowa Shannon L. Rabideau, Adam J. Deppe. Mentor: Eugene S. Takle Department of Geological and Atmospheric Sciences, Iowa State University Introduction Accurate wind speed forecasts are very important for the growing wind energy industry due to the relationship between speed and power. More data analysis is needed using observed wind speeds at “tall tower” heights to determine the accuracy of forecasts since most prior research has extrapolated these speeds from 10m measurements. The purpose of this study is to analyze how well various schemes and ensembles of the WRF can predict wind speeds at 80 m at an Iowa site by examining a total of 32 cases, 8 per season. Results Results (cont.) Winter Day 1 GFS Day 1 NAM Spring Data and Methodology Wind speeds at 80 m were provided by MidAmerican Energy Corporation from a meteorological tower located within their Pomeroy, IA wind farm in 10 min format and were then averaged hourly. Data spanned the period from June 2008 to May 2009. For this analysis, missing or highly suspect data were eliminated. Forecasted speeds were provided by a graduate student, Adam Deppe, and included 6 different planetary boundary layer schemes and 2 different initializations (GFS and NAM) run at a grid resolution of 10 km for a domain covering Iowa and surrounding states. Ensemble means were calculated for both initializations as well. The hypothesis was tested that WRF can forecast wind speeds at 80 m with an average mean absolute error < 2.0 m s-1for the daytime period on the second full day of the 54 hr forecast period in all seasons with a confidence level of 95%. A Richardson number was also computed for each time step and used to describe the stability of the atmosphere at that time. An equal number of data points were chosen to fall within unstable, neutral, and stable categories. Again, any suspect data was excluded, resulting in the loss of 2 cases due to erroneous temperature data. Mean absolute error values were again computed to see how the schemes performed during different stability categories. Day 2 GFS Day 2 NAM Summer The tables above show the mean absolute error (m s-1) of the forecasted wind speeds for all WRF schemes and for differing degrees of stability, over 30 cases. The degree of stability to which a time period corresponded was determined by computing a Richardson number. • Conclusions • The ensemble mean tends to produce the lowest mean absolute error for both initializations through all seasons, although the YSU also performs well. • MYNN 2.5 and MYNN 3.0 perform well in the spring but poorly in the winter. • QNSE has consistently higher mean absolute error values than the other schemes through both initializations and all seasons. • The hypothesis proved false for both initializations, with an average mean absolute error greater than 2.0 m s-1 (with a confidence interval of 95%) for all seasons except spring. However, the GFS was much closer to the threshold (< 0.1 m s-1 over, through all seasons) and would have proven true without the confidence interval. • All of the models perform fairly evenly for stable conditions. • The Pleim, YSU, and ensemble mean all perform well during neutral and unstable conditions. Fall Figure 1 Total Pomeroy Acknowledgements I would like to thank Eugene Takle for guidance and support on this project and MidAmerican Energy Company for providing the observations. Partial funding was supplied by NSF grant BCS0618823, DOE grant #13-450-141201, Ames Laboratory Project 290-25-09-02-0031, and PSERC grant#400-60-12. The figures above show the mean absolute error of the forecasted wind speeds for each WRF scheme and the ensemble mean, both for GFS and NAM initialization. This is for the forecast period of daytime on the second full day. A mean absolute error of 2.0 m s-1 is plotted as a reference level for comparisons. The last graphs also show a confidence level of 95%. Figure 1 shows an example of the WRF domain used, the grid resolution, and the location of the meteorological tower site.