Download
1 / 77
770 likes | 911 Vues
RadViz Extensions with Applications. Dissertation Defense John Sharko October 26, 2009. Committee. Prof. Georges Grinstein (Advisor) Prof. Kenneth Marx Prof. Haim Levkowitz Dr. Patrick Hoffman Dr. Alex Gee. Outline. Introduction RadViz Cluster Ensembles Fuzzy Clusters Methodology

E N D
RadViz Extensions with Applications Dissertation Defense John Sharko October 26, 2009
Committee • Prof. Georges Grinstein (Advisor) • Prof. Kenneth Marx • Prof. Haim Levkowitz • Dr. Patrick Hoffman • Dr. Alex Gee
Outline • Introduction • RadViz • Cluster Ensembles • Fuzzy Clusters • Methodology • Contributions • Recommendations
Description of Traditional RadViz Each dimension in a dataset is represented by a point, called an anchor point, on the circumference of a circle. Each record in the dataset is positioned as if it were being pulled by a spring attached to each anchor point where the strength of the spring is proportional to that record’s coordinate or value for the dimension related to that anchor point.
Terminology • Dimensional Anchor (Anchor Point) – point on the circle representing a dimension • Point • representation of record(s) within the circle
RadViz Mathematical Formulation where: xi and yi are the resulting transformed coordinates for record i θj is the angular position on the circle corresponding to dimension j ai,j is the value for dimension j for record i d is the number of dimensions and n the number of records.
Impact of Exchanging Dimensional Anchors A A B C (1, 0, 1, 0) D D C B
Example of Repositioning Anchor Points Using Layout Algorithm Before repositioning After repositioning
Multiple Clustered Datasets • Clustering algorithms are heuristic, not optimal • Different clustering algorithms tend to generate different clusters
Fuzzy Clusters • A record belongs to multiple clusters • Varying strengths of association
Using RadViz to Analyze Multiple Clustered Datasets • RadViz typically deals with real numbers • Cluster number just does not work • How do you produce a meaningful RadViz visualization?
Flattening of Categorical Data • Break up each original dimension into multiple dimensions • Each new dimension represents a value of the original dimension
Flattening a Dimension Flattened Manufacturer Model Small Large Sporty Van Price Original Manufacturer Model Type Price Original Record: (Cadillac, Deville, Large, 33) Flattened Record: (Cadillac, Deville, 0, 1, 0, 0, 33)
Flattening Multi Cluster Dataset Flattened Dimensions 1 2 1 2 3 1 2 3 4 Original Dimensions Algorithm A Algorithm B Algorithm C { { A B C A B C { Sample Record: (2, 1, 4) (0, 1, 1, 0, 0, 0, 0, 0, 1 )
Simple Example • Iris dataset • Three cluster sets • KM1: K-means clustering with 1000 iterations • KM2: K-means clustering with 100,000 iterations • HC: hierarchical clustering • Ten clusters per cluster set
Flattened Multi-cluster Iris Dataset KM1 Color Scale 10 9 8 7 6 5 4 3 2 1 HC-6
Flattened Multi-cluster Iris Dataset - Jittered KM1 Color Scale 10 9 8 7 6 5 4 3 2 1 HC-6
Flattened Multi-cluster Iris Dataset KM1 Color Scale 10 9 8 7 6 5 4 3 2 1 HC-6
Repositioning Dimensional Anchors • Move points away from the center • Separate points • Increase displayed information content
Class Discrimination Layout Algorithm • Select a dimension that classifies the records • Assign each dimension to the class with the highest values with respect to the other classes • Move the dimensional anchors assigned to the same class next to each other to form a classification sector
Example of Class Discrimination Layout Algorithm Before After Class Classification Sector 1 1 2 Classification Sector 2
After Repositioning Dimensional Anchors KM1 Cluster Size 30 records 20 records 10 records 5 records
After Repositioning Dimensional Anchors KM1-2 KM1 Cluster Size 30 records 20 records 10 records 5 records
After Repositioning Dimensional Anchors KM1 Cluster Size 30 records 20 records 10 records 5 records
After Repositioning Dimensional Anchors KM1 Cluster Size 30 records 20 records 10 records 5 records
After Repositioning Dimensional Anchors KM1 Cluster Size 30 records 20 records 10 records 5 records
After Repositioning Dimensional Anchors KM1 Cluster Size 30 records 20 records 10 records 5 records
After Repositioning Dimensional Anchors KM1 Cluster Size 30 records 20 records 10 records 5 records
Moving Similar Classification Sectors Close to Each Other -Dimensions have been grouped together into classification sectors -Determine which record classes are most similar to each other using Euclidean distances -Move those dimension sectors closer to each other using greedy algorithm -Records will tend to be moved away from the center
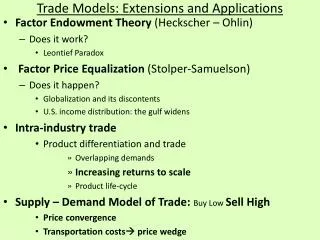
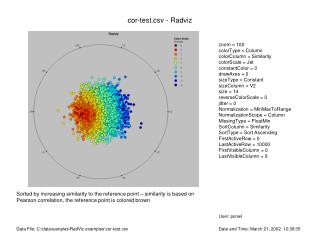
Repositioning Classification Sectors KM1 Color Scale KM2-5 KM1-7 KM1-3 HC-9 10 9 8 7 6 5 4 3 2 1 KM2-10 KM1-4 HC-5 7 HC-3 4 3 KM1-2 KM1-8 8 2 HC-6 HC-2 1 5 KM1-1 KM2-4 KM2-2 6 KM1-5 9 10 KM2-6 HC-8, HC-7 KM2-3, KM2-8 KM2-1, HC-10 KM2-9, KM1-6 HC-1 KM1-9 KM1-10 HC-4 KM2-7
Interpreting Vectorized RadViz Petal length Setosa Virsicolor Virginica Sepal length
Interpreting VRV Petal length Setosa Virsicolor Virginica Sepal length
Interpreting VRV Petal length Setosa Virsicolor Virginica Sepal length
Interpreting VRV Petal length Setosa Virsicolor Virginica Sepal length
Interpreting VRV Petal length Setosa Virsicolor Virginica Sepal length
Salamander Gene Expression Levels Expression Levels Time
Salamander Class 9 Genes Nvg00226 Nvg00111 Nvg00155 Nvg00091
Salamander Class 9 Genes • Nvg00111 • “Key” gene • CXC chemokine, ligand 10 • Nvg00226 • No homology • Nvg00155 • Keratin type II cytoskeletal • Nvg00091 • Annexin
Description of Fuzzy Clusters • K-means clustering algorithm used • Four clusters • Applied to Iris dataset