Download
1 / 36
360 likes | 507 Vues
Linking Customer and Employee Feedback to Business Results. Manager, Quality Systems, Nestlé Purina PetCare Company. Adam Pollard. Quality Systems Group…. Charter:

E N D
Manager, Quality Systems, Nestlé Purina PetCare Company Adam Pollard
Quality Systems Group… Charter: • Develop and implement world-class non-financial performance measures and systems in support of continuous improvement in customer relations, products and our workplace.
Quality Systems Group… Guiding Principles: • Linkage: Continually evaluated by the ability to predict/produce business results. • System-based: Implemented with systems that support on-going decision making. • Model-based: Developed in context with an overall conceptual model. • Ethics: All data protected in accordance with the guidelines set forth by the American Psychological Association.
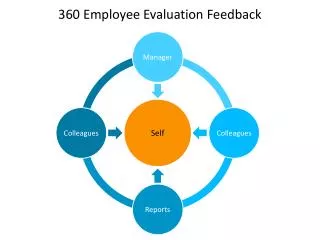
Triangle Model… Business Results Customer Measures Employee Measures
Sales Example… $ Sales Customer Satisfaction Index (CSI) Organizational Capabilities Questionnaire (OCQ)
Approach Deployed Throughout NPPC… Safety, Quality, Productivity MFG MKT Share CSI OCQ Fill rates, On Time MKTG Product Quality OCQ ORM CSI OCQ
And Customers… Category Growth Retail Customers Shopper Satisfaction Retail OCQ
Sales Example in Depth… $ Sales LINK Customer Satisfaction Index (CSI) Organizational Capabilities Questionnaire (OCQ)
The OCQ Process… • Developed from NPPC Blueprint; tailored to each function; “behaviors, processes and outcomes” • Annual, “comprehensive” length survey (130+ items) • Work team focus (teams with 3+ associates) • Confidential responses • 92+% average response rate
The OCQ Process Provides… • Team- and department-level feedback • Increased knowledge of functional role in implementing NPPC Blueprint strategies • Deployment of “voice of the customer”; early warning on potential customer issues
The OCQ Process Does Not Provide… • A means of evaluating leaders by survey scores; “team” scores are not reported to anyone but the responsible team leader • Longitudinal data at the team level • Data for any purpose other than continuous improvement and benchmarking
Data Displays Provide Comparison Within Function… 10 11 13 12 14 NPPC makes it easy for our customers to do business with us. Team members feel they have the authority to make the customer decisions they need to make. CDG Leadership places priority on developing and enhancing integrated customer relationships. When I make a commitment to the customer, I feel that I will be backed up. My team’s contacts with functions outside of procurement have increased in the past year. 1 2 3 4 5 6 7 1 2 3 4 5 6 7 1 2 3 4 5 6 7 1 2 3 4 5 6 7 1 2 3 4 5 6 7 CDG CDG CDG CDG CDG 4.97 5.72 5.98 6.07 6.17 Your Team Your Team Your Team Your Team Your Team 3.00 5.25 5.75 6.33 6.25
Sales Example… $ Sales R2 = .38 (1992-2011) LINK Organizational Capabilities Questionnaire (OCQ)
Sales Example… $ Sales LINK Customer Satisfaction Index (CSI)
And Easily Completed… Nestlé
The CSI Process… • Focuses on identified “drivers” of customer satisfaction • Essential part of our comprehensive CSM process • Provides data for linkage work • “Tactically” focused • Provides an indirect measure of our customer integration
The CSI Process Provides… • Increased role clarity • Deployment of key drivers of customer satisfaction • Customer-specific and longitudinal feedback • A means of evaluating effect of customer-focused initiatives • Input for recognition for effective action and/or sustained high scores
The CSI Process Does Not Provide… • A means of comparing customer contact personnel • A means to evaluate personnel based on scores
Sales Example… $ Sales R2 = .22 (1992-2011) Customer Satisfaction Index (CSI)
Once Linkage is Established… $ Sales CSI OCQ
Further Deployment is Possible… $ Sales Full circle Feedback CSI OCQ
Lets Take a Look at Some Other Examples… Safety, Quality, Productivity MFG MKT Share CSI OCQ Fill rates, On Time MKTG Product Quality OCQ ORM CSI OCQ
Sample Manufacturing Items… • Safety • “We take the time to review all accidents and near misses.” • Quality • “Employees are trained in finding potential problems before they are observed by team leaders or the QA lab.” • Customer Service • “We deliver complete orders/high % fill rate.” • Target Savings • “Employees have an understanding of cost structures and how they can be impacted.” • Team Effectiveness • “My team has a clear understanding of how each other’s roles and responsibilities work together.” • People Leadership • “My supervisor/team leader maintains good working relationships by respecting and cooperating with other departments.”
Sample Findings… • Total production positively correlated with: • Leadership effectiveness subscale • Perceived respect and trust among team members • Perceived cooperation of supervisor with other groups • Perception of supervisor dealing with poor performance in a timely manner • Recordable injury rate is negatively correlated with: • Perception that associates take the time to review all accidents and near misses
Sample Findings… • Final quality is positively correlated with: • Quality subscale • Customer Service subscale • Perceptions that they provide high quality unit loads at delivery • Consumer Complaints Index is negatively correlated with: • Customer Service subscale • Plant controllable on-time arrival is positively correlated with: • Perception that they provide orders on time or at the time requested • Perception that they deliver accurate orders • Perception that there are effective processes in place for continuously improving shipment accuracy
Marketing… Safety, Quality, Productivity MFG MKT Share CSI OCQ Fill rates, On Time MKTG Product Quality OCQ ORM CSI OCQ
Perceived Quality Matters… Brands R2 = .72 (1999-2011)
Customers… Category Growth Retail Customers Shopper Satisfaction Retail OCQ
The Perceived Quality of the Shopping Experience Matters… Retailers R2 = .20 (2000-2011)
In Summary… • Ensure measure relevancy • Make sure customer and employee (perceptual) measures “count” • DON’T “MULTI-TASK” MEASURES! • Ensure your measures are “talking to each other” • Build trust in their positive use