Download
1 / 11
130 likes | 227 Vues
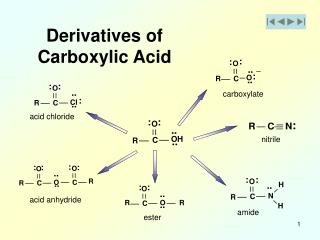
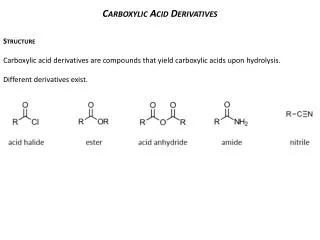
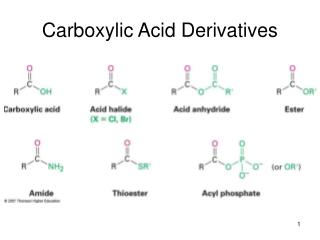
Section 20.21 Spectroscopic Analysis of Carboxylic Acid Derivatives. O. O. O. O. O. CH 3 CCl. CH 3 COCCH 3. CH 3 COCH 3. CH 3 CNH 2. Infrared Spectroscopy. C=O stretching frequency depends on whether the compound is an acyl chloride, anhydride, ester, or amide.

E N D
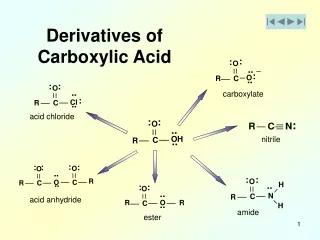
Section 20.21Spectroscopic Analysis ofCarboxylic Acid Derivatives
O O O O O CH3CCl CH3COCCH3 CH3COCH3 CH3CNH2 Infrared Spectroscopy C=O stretching frequency depends on whether thecompound is an acyl chloride, anhydride, ester, oramide. C=O stretching frequency n 1822 cm-1 1748 and 1815 cm-1 1736 cm-1 1694 cm-1
O O CH3COCCH3 Infrared Spectroscopy Anhydrides have two peaks due to C=O stretching. One results from symmetrical stretching of the C=Ounit, the other from an antisymmetrical stretch. C=O stretching frequency n 1748 and 1815 cm-1
Infrared Spectroscopy Nitriles are readily identified by absorption due to carbon-nitrogen triple bond stretching in the 2210-2260 cm-1 region.
O O RCOR' R'COR O O C C C H H 1H NMR 1H NMR readily distinguishes between isomericesters of the type: and is less shielded than
O O CH3COCH2CH3 1H NMR For example: CH3CH2COCH3 and Both have a triplet-quartet pattern for an ethylgroup and a methyl singlet. They can beidentified, however, on the basis of chemicalshifts.
O O CH3COCH2CH3 5.0 4.0 3.0 2.0 1.0 0 5.0 4.0 3.0 2.0 1.0 0 Figure 20.9 CH3CH2COCH3 Chemical shift (d, ppm)
13C NMR Carbonyl carbon is at low field (d 160-180 ppm), but not as deshielded as the carbonyl carbon of an aldehyde or ketone (d 190-215 ppm). The carbon of a CN group appears near d 120ppm.
O O O O O CH3CCl CH3COCCH3 CH3COCH3 CH3CNH2 UV-VIS nÆp* absorption: lmax 235 nm 225 nm 207 nm 214 nm
•• •+ O O •• •• + RC RCX RCX • O X •• •• •• •• Mass Spectrometry Most carboxylic acid derivatives give a prominentpeak for an acylium ion derived by thefragmentation shown. +
•• •+ O O •• •• + •• • O RCNR'2 RCNR'2 NR'2 R C •• •• •• Mass Spectrometry Amides, however, cleave in the direction that givesa nitrogen-stabilized cation. +