Download
1 / 45
470 likes | 1.01k Vues
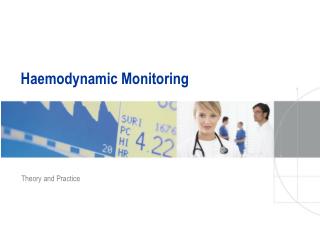
PiCCO 2. Less Invasive Advanced Haemodynamic Monitoring. Training. Short. Content. PULSION Medical Systems See more than others – PiCCO 2 Medical concept and parameter PiCCO 2 – the technology. PULSION Medical Systems.

E N D
PiCCO2 Less Invasive Advanced Haemodynamic Monitoring Training Short
Content • PULSION Medical Systems • See more than others – PiCCO2 • Medical concept and parameter • PiCCO2 – the technology
PULSION Medical Systems • Manufacturer of medical equipment from Munich, Germany, established 1990 • Production, development, administration, marketing and sales in Germany • Subsidiaries in USA, France, Spain, UK, Benelux and Australia PULSION head quarters in Munich, Germany
PiCCO-Technology • Market leader for less invasive haemodynamic monitoring • Paradigm shift in haemodynamics by the PiCCO-Technology • Integration of the PiCCO-Technology into multi-parameterpatient monitoring systems PiCCO22007 Draeger Smart Pod 2005 Philips PiCCO Module 2003 PiCCO plus 2002 COLD System 1990 PiCCO 1997
PiCCO2 – See more than others • Continuous ScvO2 • Cardiac output • Volumetric preload • Contractility • Afterload • Volume responsiveness • Pulmonary oedema – measured at the bedside
The doctor’s dream? recognize problems earlier… I should immediately know the reasons for it… detect if the therapeutic decisions are correct… 7
Basis of success – fast decision lanes 1. Quick overview! 2. Acquire details! 3. Follow trend!
PiCCO2 – visualize decision lanes 1. SpiderVisionRisk assessment with one view 2. ProfileDetailed insight on parameter level 3. TrendsClinical course and therapy results 9
Optimization of tissue oxygenation O2 intake O2 transport O2 delivery O2 consumption PiCCO-Technology CeVOX-Technology Which therapy ? - + - + - + + - + Volume? Vasopressors? Inotropics? Blood transfusion? Ventilation 10
PiCCO2 parameter visualize physiology Global oxygenationScvO2 Oxygen delivery Oxygen consumption Cardiac output Arterial oxygen content Haemoglobine Hb Oxygenation SaO2 Heart rate Stroke volume Afterload SVRI; MAP Preload GEDI; SVV; PPV Contractility GEF; CFI; dPmx Pulmonary Oedema ELWI; PVPI Vasopressors? Inotropics? Volume? Blood transfusion?
Parameter fields – from overview to details Overview Details Cont. Cardiac Output Cont. Cardiac Output TD Cardiac OutputAfterloadLeft Heart Contractility Preload Volume Preload VolumeVolume Responsiveness Lung Water Lung WaterPulmonary Vascular Permeability Cardiac ContractilityCardiac Power Central venous Oxygenation Central venous Oxygenation Oxygen Delivery Oxygen Consumption
Data visualization – PiCCO2 accompanies your decision process SpiderVisionDynamic risk level indicator ProfilesDetailed insight at parameter level • TrendsTrack the clinical trends & thera-peutic results
Distinguished by easy & intuitive handling Structured and visualized information for fast recognition Reflects the physiology of the patient Based on medical processes and way of thinking PiCCO2 PiCCO2 is physiologic… for the patient and the operator !!! 14
CO Heart Rate Stroke volume Prelaod Contractility Afterlaod Cardiac Output Cardiac Output – Volume of blood pumped by the heart in one minute • PCCO – Pulse Contour Cardiac Output • PCCI – Pulse Contour Cardiac Index • Stroke Volume depends on Preload, Contractility and Afterload • Index (PCCI) related to body surface area
CO Measurement • Transpulmonary Thermodilution • Discontinuous Combination of two measurement techniques for maximum precision of continuous CO determination Calibration • Pulse Contour Analysis Continuous (Beat-by-Beat)
Preload – Volume instead of filling pressures Preload – Blood volume in the heart, available to be pumped • GEDV – Global End-diastolic Volume • GEDI – Global End-diastolic Volume Index • Filling volume of all four heart chambers • Preload volume is necessary for an adequate CO • GEDI is indexed to “predicted body surface area”
ITBV900 ml/m² Preload – Volume instead of filling pressures Preload – Blood volume in the heart, available to be pumped • ITBV – Intrathoracic Blood Volume • ITBI – Intrathoracic Blood Volume Index • Filling volume of all four heart chambers and pulmonary blood volume • Preload volume is necessary for an adequate CO • ITBV is indexed to “Predicted Body Surface Area”
Differenzierung: Volumen /Katecholamine Preload – direct correlation of preload and CO CI (l/min/m2) 7.5 5.0 Inotropic drugs 2.5 Preload increased / Volume recruitment GEDI (ml/m2) 200 400 600 800 1000 1200 1400 Frank-Starling curve • Volume substitution increases cardiac output to the maximum • After preload optimization further increase is only possible by an increase of the contractility by inotropic drugs
Contractility Contractility – Performance of the cardiac muscle Changes of cardiac performance during constant preload, afterload and heart rate are caused by changes of contractility dPmx – Left Heart Contractility • Maximum of pressure increase in the aorta (P/tmax) • Excellent correlation to the maximum pressure increase speed in the left ventricle
Contractility GEF - Global Ejection Fraction • Parameter of the global cardiac contractility • Global Stroke Volume divided by Global End-diastolic Volume • GEF = 4 x SV / GEDV
V V V V V Contractility CFI - Cardiac Function Index • Parameter of the global cardiac contractility • Fraction of the preload volume, which is pumped in one minute • Cardiac Index divided by Global End-diastolic Volume CFI = CI / GEDI CI SV V High Contractility SV SV NormalContractility SV SV LowContractility SV Volume Overload Preload Target Area Volume Responders
Cardiac Power CPI - Cardiac Power (Index) • Surrogate parameter of the global cardiac capability • Unspecific indicator of cardiac malfunctioning • Mean Arterial Pressure multiplied by Cardiac Index:CPI = MAP x CI • Best predictor of mortality in patients with cardiogenic shock
Flow (CO) = Vasoconstriction: Flow (CO) Pressure Resistance Vasodilation: Flow (CO) Afterload Afterload – Pressure the heart has to overcome to eject blood If other variables are unchanged cardiac output decreases when afterload increases. SVRI -Systemic Vascular Resistancemost important factor of afterload
O2 Delivery O2 Consumption • CO (Cardiac Output) • Hb (Haemoglobine) • SaO2 (Arterial Oxygen Saturation) ScvO2 • Temperature (fever)↑ • Muscle work (tremor) ↑ • Stress ↑ 70-80 % ScvO2 - Indicator for insufficient tissue oxygenation • ScvO2 – Central Venous Oxygen Saturation • Measurement via Standard CVC • SvO2 (Mixed Venous Oxygen Saturation) only possible by high invasive measurement with a PA catheter • good clinical correlation between ScvO2 and SvO2 • Normal ranges: ScvO2 70-80% SvO2 65-75%
Delivery DO2I = CI x Hb x 1,34 x SaO2 CO, Hb SaO2 Oxygen intake Oxygen transport Oxygen delivery Oxygen consumption S(c)vO2 VO2I = CI x Hb x 1,34 x (SaO2 – S(c)vO2) Consumption Oxygen Delivery and Oxygen Consumption • DO2I – Oxygen Delivery (Index) • calculated from Cardiac Index, Haemoglobine and Arterial Oxygen Saturation • VO2I– Oxygen Consumption (Index) • calculated from Cardiac Index, Haemoglobine, Arterial and Mixed Venous Oxygen Saturation • Normal ranges: DO2 400 - 650 ml/min/m2 VO2 125 - 175 ml/min/m2
SVmax PPmax PPmin SVmin Volume Responsiveness Volume Responsiveness • Volume Responsiveness predicts if volume administration (e.g. for preload increase) will result in an increase of Cardiac Output SVV – Stroke Volume Variation PPV – Pulse Pressure Variation • During inspiration blood volume shifts in the circulation resulting in a change of preload • Significant changes of Stroke Volume are called Stroke Volume Variation • Significant changes of Pulse Pressure are called Pulse Pressure Variation Attention: Only applicable in patients under controlled mechanical ventilation and with sinus rhythm.
SVV/PPV – Volume demand predicted Volume Responsiveness = CO increase by preload increase SV ∆ SV2 SVV > 10% PPV > 13% SVV 0-10% PPV 0-13% ∆ SV1 ∆ EDV1 ∆ EDV2 EDV Frank-Starling curve
SVV and PPV - Limitations Check list for the correct use of the parameters of Volume Responsiveness: • Is the patient under controlled mechanical ventilation? • Does the patient have sinus rhythm without arrhythmia? Is the arterial pressure curve free from artefacts?
Lung Water EVLW – Extravascular Lung water • Direct and easy quantification and monitoring of lung oedema at the bedside • Includes intra-cellular, interstitial and intra-alveolar water (not pleural effusion) • ELWI is indexed to “Predicted Body Weight” (theoretical body weight)
ELWI 21 ml/kg BW ELWI 11 ml/kg BW ELWI 5 ml/kg BW severely increased Lung Water moderately increased Lung Water no Lung Water increase Pulmonary Oedema Pulmonary Oedema • Infiltration of water into the lung tissue caused by inflammatory or cardiac processes disables the gas exchange (oxygenation of blood) and is difficult to quantify by conventional methods
Alveolus wall Alveolus wall Cardiogenic Lung OedemaIncreased hydrostatic pressure with normal permeability Permeability Lung OedemaNormal hydrostatic pressure with increased permeability Capillary Capillary Alveolus Pulmonary Vascular Permeability PVPI – Pulmonary Vascular Permeability Index • Differentiation of the origin of pulmonary oedema (inflammatory or cardiogenic) • Relation between extra- und intra-vascular fluid (EVLW/PBV)
Parameter - Interaction during volume administration • Insufficient preload volume is treated with volume administration • Optimizing preload may increase CO to the maximum • Further volume administration beyond this point will not improve CO but increase Lung Water CO 5 3 EVLW 7 3 Preload
Parameter - Interaction during volume withdrawal • Volume withdrawal to decrease Lung Water may influence preload volume and thus CO • The target is balancing sufficient preload volume for adequate CO and Lung Water as low as possible CO 5 3 EVLW 7 3
More information – less invasiveness Central venous access (Standard CVC) Only standard accesses necessary Femoral arterial access (PiCCO Catheter) alternative: axillary arterial, brachial arterial
Fields of application • Intensive Care • Septic Shock • Cardiogenic Shock • Burns • Trauma / Hypovolaemic Shock • ARDS • Pancreatitis • Paediatrics • Intra-operative • Cardiac Surgery • Mayor Surgery • Neuro Surgery • Paediatrics
PiCCO2 – The new haemodynamic monitor • 13,3“ colour wide screen • Touch-screen, navigation dial • Elegant, light housing • Solid foil • Protected Connectors • Small footprint • Compatible to standard mounting systems • Lithium-Ion battery 37
PiCCO2 248 mm 328 mm 180 mm
Information bar Real-time pressure curve Parameter fields Innovative data visualization Direct access buttons Innovative operation via touch-screen or navigation dial
Front On/Off Help Print Mute Main Back Navigation dial
Rear ScvO2 (optical module) CO (temperature) Mains switch Mains connector AP (Pressure) Grounding CVP (Pressure)
Interface connections Interfaces for current and future demand AP Out CVP Out Serial Interface LAN 2 x USB
Mounting systems • Cart • Wall mounting Horizontal standard bar ITD support system GCX support system
PiCCO2 • Distinguished by easy and intuitive handling • Structured and visualized information for fast recognition - SpiderVision, Profile, Trends • Reflects the physiology of the patient - only monitor with preload volume and lung water - integrated ScvO2 monitoring • Based on medical processes and way of thinking 44
Contact PULSION Medical Systems AGJoseph-Wild-Str. 20D-81829 MunichGermanyTel. +49-(0)89-459914-0info@pulsion.comwww.PULSION.com w w w . P i C C O 2 . com