Download
1 / 62
620 likes | 1.05k Vues
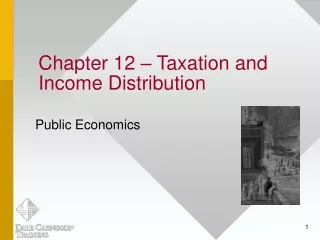
Chapter 12 Income Distribution, Poverty, and Discrimination. Key Concepts Summary Practice Quiz Internet Exercises. ©2000 South-Western College Publishing. In this chapter, you will learn to solve these economic puzzles:. How can a negative income tax solve the “welfare mess”?.

E N D
Chapter 12Income Distribution, Poverty, and Discrimination • Key Concepts • Summary • Practice Quiz • Internet Exercises ©2000 South-Western College Publishing
In this chapter, you will learn to solve these economic puzzles: How can a negative income tax solve the “welfare mess”? What is the effect on labor markets of laws that protect women from jobs deemed “too strenuous” or “too dangerous”? Could the rich become richer in the 1980’s and other income groups also become better off?
What is the general trend of Income Distribution? Since 1970, the percentage of income received by families in the lowest 20% has fallen, while the percentage received by families in the 20% highest income groups have risen
Division of the Total Annual Money Income Among Families % of Families 1980 1990 1997 4.6% 5.1% Lowest 5th 4.2% Second-lowest 5th 11.5 10.8 9.9 17.5 15.7 16.6 Middle 5th 24.3 23.8 23.0 Second-highest 5th 41.6 44.3 47.2 Highest 5th Highest 5% 15.3 17.4 20.7
What is Median Income? 50% of families earn less than the median income and 50% earn more
Median Income of Families, 1994 Median Income Characteristic All families $44,568 Headed by a male $32,960 Headed by a female $21,023 With head aged 25-34 $39,979 With head aged 65 and over $30,660 Headed by a high school grad $40,040 $67,230 Person with a bachelor’s degree
What are some arguments against income inequality? • Wealthy can influence politics • Wealthy have more opportunities • Wealthy can afford better health care
What is an argument for income inequality? Income inequality gives people an incentive to become more productive
What is theLorenz Curve? A graph of the actual cumulative distribution of income compared to a perfectly equal distribution of income
Hypothetical Lorenz Curve 100% Perfect Equality 80% 60% % of income 40% Actual Income 20% % of families 20% 40% 60% 80% 100%
Lorenz Curve 1929 & 1997 100% Perfect Equality 80% 60% 1997 % of income 40% 20% 1929 % of families 20% 40% 60% 80% 100%
Lorenz Curve for Nations 100% Perfect Equality 80% 60% Russia % of income 40% Brazil 20% U.S. % of families 20% 40% 60% 80% 100%
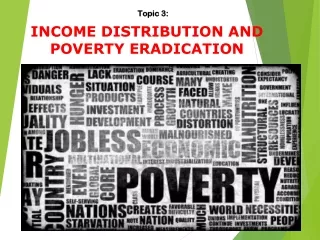
What is the Poverty Line? The level of income below which a person or a family is considered to be poor
Does the Poverty Line consider Cash Transfer Income? Yes; Social Security, unemployment compensation, and Aid to Families of Dependent Children are considered
What areIn-kind Transfers? Government payments in the form of goods and services, rather than cash
Does the Poverty Line consider In-kind transfers? Receipts from government programs such as food stamps, Medicaid, and housing are not included
22% 13% 14% 14% 13% 13% 12% 1959 1970 1975 1980 1985 1990 1997
% of U.S. Persons below Poverty Level Characteristic % Headed by married couple 5% Headed by a male, no wife 13% Headed by a female, no husband 32% 24% No high school diploma 10% High school diploma, no college 2% Bachelor’s degree or more
What are examples of Cash Transfer Programs? • Social Security • Unemployment Compensation • Aid to Families with Dependent Children
What are examples of In-kind Transfer Programs? • Food stamps • Medicaid • Housing Assistance
What are major criticisms of Welfare? • Work disincentives • Inefficiencies • Inequities
What are examples of Reform Proposals? • Negative income tax • Workfare
What is a Negative Income Tax? A plan under which families below a certain break-even level of income would receive cash payments that decrease as their income increases
Negative Income Tax $10 Positive Tax $5 0 Tax Liability $-5 Negative Tax $-20 Family Income $10 $20 $30 $40 $50
What is Workfare? Recipients of government programs have to work to receive the benefits
Can Discrimination effect People’s wage rate? Certain groups can receive more or less income if there is discrimination in the labor market
How does Comparable Worth effect wages? Employees who work for the same employer must be paid the same wages when their jobs, even if different, require similar levels of education, etc.
Key Concepts • What is Median Income? • What are some arguments against income inequality? • What is an argument for income inequality? • What is the Lorenz Curve? • What is the Poverty Line? • What are In-kind Transfers? • Does the Poverty Line consider In-kind transfers?
Key Concepts cont. • What are examples of Cash Transfer Programs? • What are examples of In-kind Transfer Programs? • What is a Negative Income Tax? • What is Workfare? • Can Discrimination effect People’s wage rate? • How does Comparable Worth effect wages?
The Lorenz curve is a measure of inequality of income. Since 1947, the share of money income for each fifth of families ranked according to their income has been stable. Also, the degree of income inequality among families in the United States has changed little since 1929. During the 1980’s, the richest families did become richer; however, the median income of all groups increased.
Hypothetical Lorenz Curve 100% Perfect Equality 80% 60% % of income 40% Actual Income 20% % of families 20% 40% 60% 80% 100%
The poverty line is a level of cash income below which a family is classified as poor. The poverty income threshold is three times the cost of a minimal diet for a family. Today, about 12 percent of the U.S. population is officially classified as poor.
In-kind transfers are payments to the poor in the form of goods and services, rather than cash. Calculation of the poverty line counts cash income. On the other hand, in-kind transfers, such as food stamps, Medicaid, and housing, do not count as income for families classified as officially poor.
Government cash transfers counted in the poverty line include payments from Social Security, unemployment compensation, and Aid to Families with Dependent Children.
Welfare criticisms include three major arguments: (1) Welfare reduces the incentive to work for the poor and taxpayers. (2) Welfare is inefficient because much of the money covers administrative costs, rather than providing benefits for the poor. (3) Because many antipoverty programs are controlled by the state, welfare benefits vary widely.
The negative income tax is a plan to set an income guarantee for all families. As a low-income family earns income, government payments (negative income tax) are phased out. After reaching a break-even income, families become taxpayers instead of being on the welfare rolls.
Negative Income Tax $10 Positive Tax $5 0 Tax Liability $-5 Negative Tax $-20 Family Income $10 $20 $30 $40 $50
Comparable worth is the theory that workers in jobs determined to be of equal value by means of point totals should be paid equally. Instead of allowing labor markets to set wages, independent consultants award points to different jobs on the basis of such criteria as knowledge, experience, and working conditions
Chapter 12 Quiz ©2000 South-Western College Publishing
1. In 1997, the wealthiest 5 percent of all U.S. families earned what percentage of total annual money income among families? a. More than 20 percent. b. Less than 10 percent. c. More than 25 percent. d. More than 50 percent. A.
Division of the Total Annual Money Income Among Families % of Families 1980 1990 1997 4.6% 5.1% Lowest 5th 4.2% Second-lowest 5th 11.5 10.8 9.9 17.5 15.7 16.6 Middle 5th 24.3 23.8 23.0 Second-highest 5th 41.6 44.3 47.2 Highest 5th Highest 5% 15.3 17.4 20.7
2. A figure that measures the relationship between the cumulative percentage of money income on the vertical axis and the cumulative percentage of families on the horizontal axis is called the a. family-income curve. b. Washington curve. c. Lorenz curve. d. Gini curve. C.
The Lorenz Curve 100% Perfect Equality 80% 60% Inequality % of income 40% 20% % of families 20% 40% 60% 80% 100%
Exhibit 11Lorenz Curve 100% Y 80% Perfect Equality X 60% % of income 40% Z 20% W Cumulative % of families 20% 40% 60% 80% 100%
3. As shown in Exhibit 11, the perfect equality line is drawn between points a. W and Y along the curve. b. X and Z. c. W and Y along the straight line. d. W and X. C.
4. As shown in Exhibit 11, 20 percent of families earned a cumulative share of about _______ percent of income. a. 5. b. 10. c. 30. d. 50. A.
5. As shown in Exhibit 11, 40 percent of families earned a cumulative share of about _______ percent of income. a. 5. b. 15. c. 30. d. 40. B.
6. Since 1929, the overall income distribution in the United States has become a. much more unequal. b. much less unequal. c. slightly more unequal. d. slightly more equal. D.