Download
1 / 29
290 likes | 427 Vues
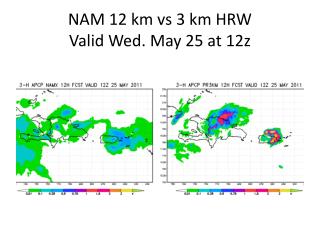
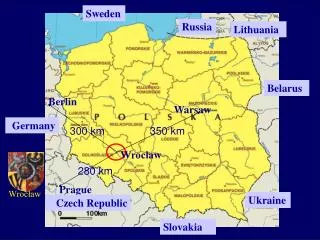
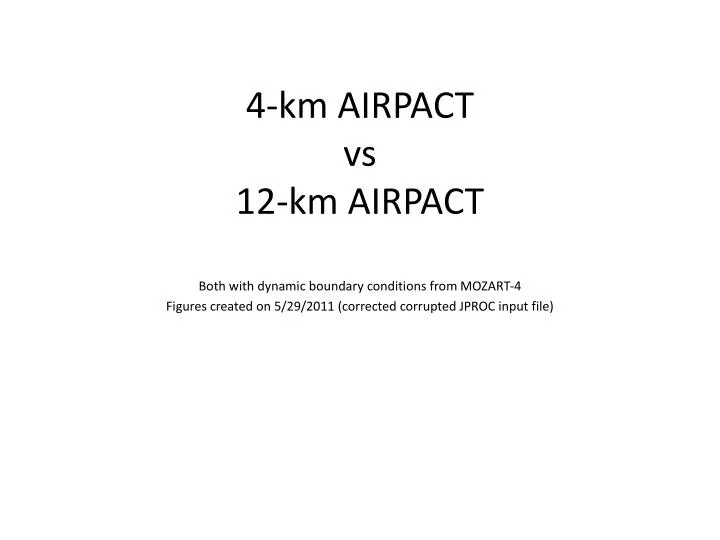
4-km AIRPACT vs 12-km AIRPACT. Both with dynamic boundary conditions from MOZART-4 Figures created on 5/29/2011 (corrected corrupted JPROC input file). New 4-km Domain. Old 12-km Domain. Old 12-km North-South Borders. New 4-km North-South Borders. GRIDDESC content is: ' '

E N D
4-km AIRPACTvs12-km AIRPACT Both with dynamic boundary conditions from MOZART-4 Figures created on 5/29/2011 (corrected corrupted JPROC input file)
New 4-km Domain Old 12-km Domain Old 12-km North-South Borders New 4-km North-South Borders GRIDDESC content is: ' ' 'LAM_49N121W' 2 30.000 60.000 -121.000 -121.000 49.000 ' ' 'AIRPACT_04km' 'LAM_49N121W' -342000.000 -942000.000 4000.000 4000.000 285 258 1 ' '
CMAQ 4.7Foley, K. M.; Roselle, S. J.; Appel, K. W.; Bhave, P. V.; Pleim, J. E.; Otte, T. L.; Mathur, R.; Sarwar, G.; Young, J. O.; Gilliam, R. C.;et al. Incremental testing of the Community MultiscaleAir Quality (CMAQ) modeling system version 4.7. Geosci. Model Dev. 2010, 3, 205–226. Incremental test simulations over the eastern United States during January and August 2006 Particulate sulfate predictions are improved across all monitoring networks during both seasons due to cloud module updates. Numerous updates to the SOA module improve the simulation of seasonal variability and decrease the bias in organic carbon predictions at urban sites in the winter. Bias in the total mass of fine particulate matter (PM2.5) is dominated by overpredictions of unspeciated PM2.5 (PMother) in the winter and by underpredictions of carbon in the summer. The CMAQv4.7 model results show slightly worse performance for ozone predictions. However, changes to the meteorological inputs are found to have a much greater impact on ozone predictions compared to changes to the CMAQ modules described here. Model updates had little effect on existing biases in wet deposition predictions.
Surface-Layer O3 Surface-Layer DO3 (@ 12-km)
Surface-Layer PM2.5 Surface-Layer DPM2.5 (@ 12-km)
Surface-Layer DO3 (@ 12-km) Surface-Layer O3 Feb 13, 2011 @ noon Feb 13, 2011 @ 11 pm
Surface-Layer DPM2.5 (@ 12-km) Surface-Layer PM2.5 Feb 13, 2011 @ noon Feb 13, 2011 @ 11 pm
Craters of the Moon: Monoterpene, Isoprene, and Total VOC Comparison Total VOC Isoprene Monoterpene
Initial Summary • VOC/NOx emissions • Urban NOx: AP4 > AP3, Urban VOC: AP4 < AP3 (VOC/NOX ratio decreases) • Rural NOx: AP4 > AP3, Rural VOC: AP4 << AP3 • MEGAN Isoprene < BEIS Isoprene (one location) • O3 Concentrations • Urban O3 AP4 < AP3 and less than observed (but wintertime conditions) • Rural O3 AP4 ~ AP3 • PM Emissions • Urban PM: AP4 < AP3 • Rural PM: AP4 ~< AP3 • PM Concentrations • Urban PM: AP4 > observed and better than AP3