Download
1 / 11
110 likes | 246 Vues
Primary Refugee Arrivals, 1999-2003. Refugee Health Program,Minnesota Department of Health. Refugee Arrivals to MN by Region of World 1979-2003. Refugee Health Program,Minnesota Department of Health. Primary Refugees Arrival & Screened Refugees in Minnesota (1995-2003).

E N D
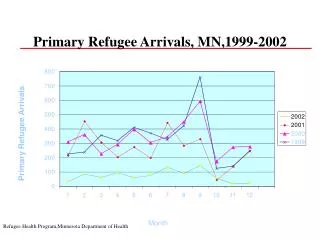
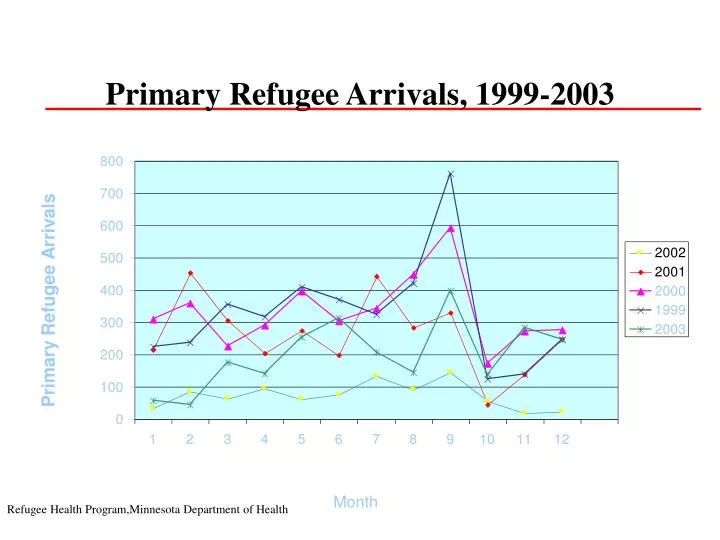
Primary Refugee Arrivals, 1999-2003 Refugee Health Program,Minnesota Department of Health
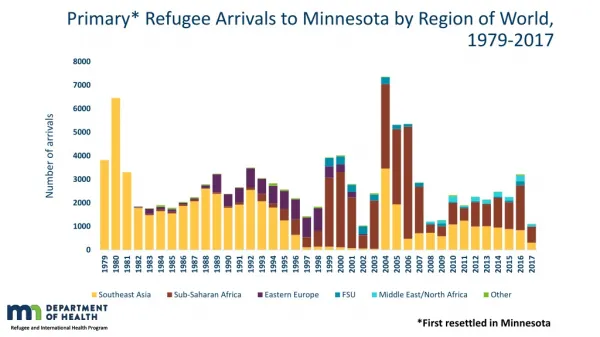
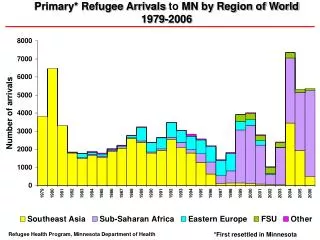
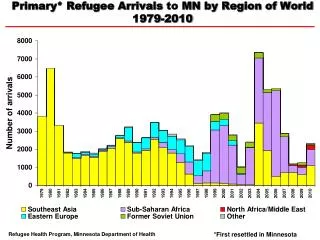
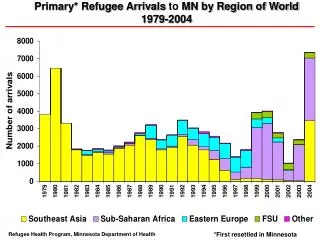
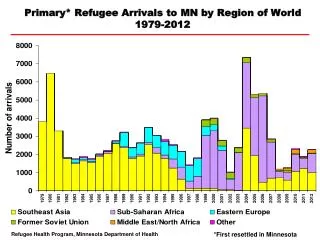
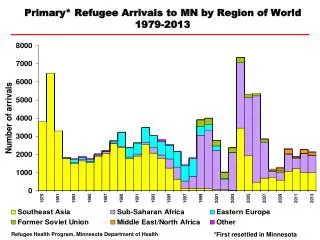
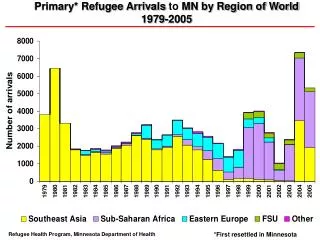
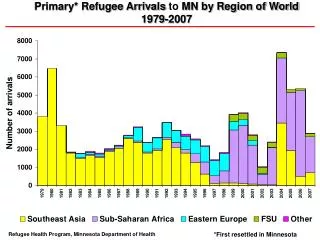
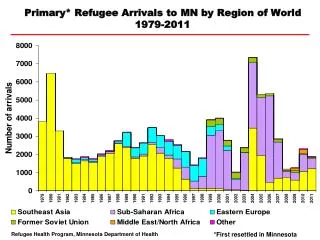
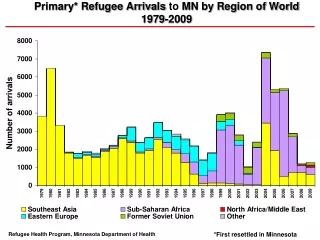
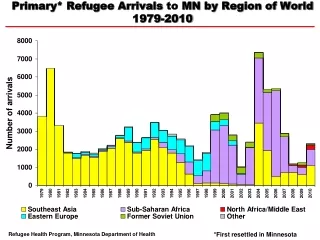
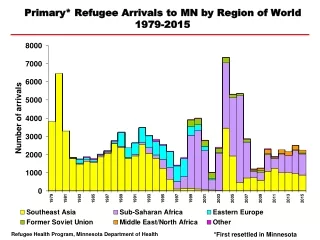
Refugee Arrivals to MN by Region of World 1979-2003 Refugee Health Program,Minnesota Department of Health
Primary Refugees Arrival & Screened Refugees in Minnesota (1995-2003) Refugee Health Program,Minnesota Department of Health
Primary Refugee Arrivals by Country of Origin Minnesota, 2003 Ethnicity pie chart N =4012 *”Other” includes: Bosnia, China, Cameroon, China, Iran,Iraq, Kenya, Sierra Leone, Togo, Vietnam.Zaire, Refugee Health Program,Minnesota Department of Health
2003 Primary Refugee Arrivals To Minnesota (N=2403) Lakeof theWoods Kittson Roseau Koochiching Marshall St. Louis Beltrami Pennington Polk Cook ClearWater Red Lake Lake Itasca Mahnomen Norman Hubbard Cass Becker Clay 0 Aitkin Wadena Crow Wing Carlton 1-25 Ottertail Wilkin Pine Todd 26-50 MilleLacs Kanabec Grant Douglas Morrison Benton 51-100 Stevens Pope Stearns Traverse Isanti Big Stone Sherburne Chisago 101-500 Swift Kandiyohi Anoka 71 Wash-ing-ton Meeker Wright Ram- sey Hennepin Chippewa Hennepin Lac Qui Parle 501-2000 Carver McLeod Renville Scott Yellow Medicine Dakota Sibley Lincoln Lyon Redwood Le Sueur Rice 2001-4000 Goodhue Nicollet Wabasha Brown Waseca Pipestone Murray Cottonwood Watonwan Blue Earth Steele Dodge Olmsted Winona Rock Nobles Jackson Martin Faribault Freeborn Mower Fillmore Houston Refugee Health Program,Minnesota Department of Health
Primary Refugees Lost to Follow-up Minnesota 2003 (N=301) Refugee Health Program,Minnesota Department of Health
Primary Refugees Screened By Region of Origin Minnesota, 2003 Ineligible for Screening Region of world Total arrivals Number (%) Screened Africa 2046 141 1775 (93%) E.Asia/Pacific 47 07 45 (96%) Europe 266 16 246 (98%) Near East 20 0 20(100%) W.Hemisphere 16 13 0(0%) Refugee Health Program,Minnesota Department of Health
Refugee Screening Rates By Test Minnesota, 2003 N=2233/2403 eligible for screening (90% Screening rate) (60/2233) (1548/2233) (1869/2233) (2013/2233) (2071/2233) Refugee Health Program,Minnesota Department of Health
Health Status of New Refugees Minnesota, 2003(N=2233*) Health issue upon arrival No (%) of refugees screened No(%) with infection among screened TB infection** 2071(93%) 1092(53%) Hep B infection*** 2013(90%) 139(6%) Parasitic Infection**** 1869(84%) 290(16%) Sexually Transmitted 1548(69%) 10(2%) Infections(STIs)***** Malaria Infection 60(3%) 3(5%) *Among total refugees eligible for screening (N=2233) **Persons with >= 10mm induration from tuberculin skin test ***Positive for HBsAg (hepatitis B surface antigen) ****Testing positive for at least one intestinal parasite infection Refugee Health Program,Minnesota Department of Health
Intestinal Parasitic Infection* Rates Among by Region of Origin –Minnesota, 2003 (3/13) (16/195) (44/282) *Overall intestinal parasite infection rate 15.5% (7/28) (264/1625) * At least one stool parasite found (including nonpathogenic) Refugee Health Program,Minnesota Department of Health
Tuberculosis Infection* Rate Among Refugees Screened By Region Of Origin , 2003 N=2071 (Refugees screened for TB infection) 14/43 106/239 961/1761 6/20 *Reaction for TB are those refugees with 10-14mm or >=15mm induration from PPD test Refugee Health Program,Minnesota Department of Health