Download
1 / 1
10 likes | 134 Vues
Anthropogenic and Biogenic Carbon Dioxide Fluxes in Urban Houston A41A-0031 Nicholas D. Werner and Gunnar W. Schade Department of Atmospheric Sciences, Texas A&M University, College Station, TX ndwerner24@tamu.edu. BACKGROUND. METHODS, DATA & RESULTS. QUADRANT ANALYSIS.

E N D
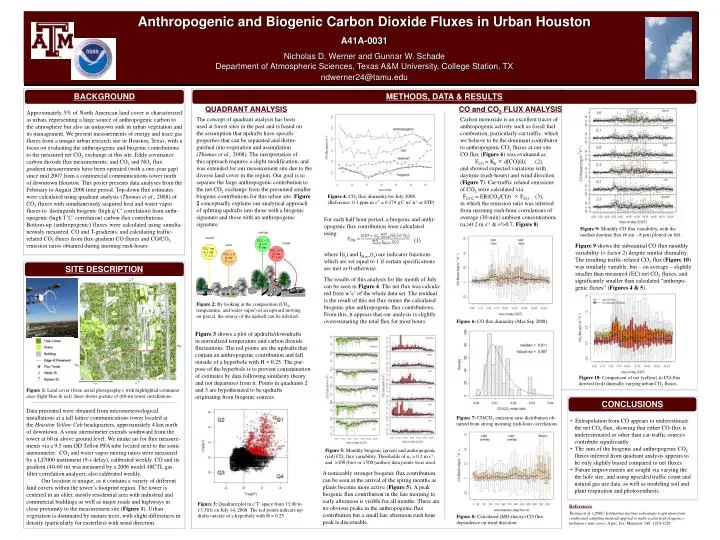
Anthropogenic and Biogenic Carbon Dioxide Fluxes in Urban Houston A41A-0031 Nicholas D. Werner and Gunnar W. Schade Department of Atmospheric Sciences, Texas A&M University, College Station, TX ndwerner24@tamu.edu BACKGROUND METHODS, DATA & RESULTS QUADRANT ANALYSIS CO and CO2 FLUX ANALYSIS Approximately 5% of North American land cover is characterized as urban, representing a large source of anthropogenic carbon to the atmosphere but also an unknown sink in urban vegetation and its management. We present measurements of energy and trace gas fluxes from a unique urban research site in Houston, Texas, with a focus on evaluating the anthropogenic and biogenic contributions to the measured net CO2 exchange at this site. Eddy covariance carbon dioxide flux measurements, and CO2 and NOx flux gradient measurements have been operated (with a one-year gap) since mid 2007 from a commercial communications tower north of downtown Houston. This poster presents data analyses from the February to August 2008 time period. Top-down flux estimates were calculated using quadrant analysis (Thomas et al., 2008) of CO2 fluxes with simultaneously acquired heat and water vapor fluxes to distinguish biogenic (high q’C’ correlation) from anthr- opogenic (high T’C’ correlation) carbon flux contributions. Bottom-up (anthropogenic) fluxes were calculated using simulta- neously measured CO and T-gradients, and calculating traffic- related CO2 fluxes from flux-gradient CO fluxes and CO/CO2 emission ratios obtained during morning rush-hours. The concept of quadrant analysis has been used at forest sites in the past and is based on the assumption that updrafts have specific properties that can be separated and distin- guished into respiration and assimilation (Thomas et al., 2008). The interpretation of this approach requires a slight modification, and was extended for our measurement site due to the diverse land cover in the region. Our goal is to separate the large anthropogenic contribution to the net CO2 exchange from the presumed smallerbiogenic contributions for this urban site. Figure 2 conceptually explains our analytical approach of splitting updrafts into those with a biogenic signature and those with an anthropogenic signature: Carbon monoxide is an excellent tracer of anthropogenic activity such as fossil fuel combustion, particularly car traffic, which we believe to be the dominant contributor to anthropogenic CO2 fluxes at our site. CO flux (Figure 6) was evaluated as FCO = Kh × d[CO]/dz (2), and showed expected variations with daytime (rush-hours) and wind direction (Figure 7). Car-traffic related emissions of CO2 were calculated via FCO2 = ER(CO2/CO) × FCO (3), in which the emission ratio was inferred from morning rush-hour correlations of average (30-min) ambient concentrations (u*>0.2 m s-1 & r2>0.7, Figure 8). Figure 4: CO2 flux diurnality for July 2008. (Reference: 0.1 ppm m s-1 = 0.179 g C m2 h-1 at STP) For each half hour period, a biogenic and anthr- opogenic flux contribution were calculated using (1) where I(ti) and IH,w+(ti) are indicator functions which are set equal to 1 if certain specifications are met or 0 otherwise. Figure 9: Monthly CO flux variability, with the median daytime flux (8 am – 8 pm) plotted on left. Figure 9 shows the substantial CO flux monthly variability (> factor 2) despite similar diurnality. The resulting traffic-related CO2 flux (Figure 10) was similarly variable, but – on average – slightly smaller than measured (EC) net CO2 fluxes, and significantly smaller than calculated “anthropo- genic fluxes” (Figures 4 & 5). SITE DESCRIPTION The results of this analysis for the month of July can be seen in Figure 4. The net flux was calcula- ted from w’c’ of the whole data set. The residual is the result of this net flux minus the calculated biogenic plus anthropogenic flux contributions. From this, it appears that our analysis is slightly overestimating the total flux for most hours. Figure 2: By looking at the composition (CO2, temperature, and water vapor) of an upward moving air parcel, the source of the updraft can be inferred. Figure 6: CO flux diurnality (Mar-Sep 2008). Figure 3 shows a plot of updrafts/downdrafts in normalized temperature and carbon dioxide fluctuations. The red points are the updrafts that contain an anthropogenic contribution and fall outside of a hyperbole with H = 0.25. The pur- pose of the hyperbole is to prevent contamination of estimates by data following similarity theory and not departures from it. Points in quadrants 2 and 3 are hypothesized to be updrafts originating from biogenic sources. Figure 10: Comparison of net (yellow) to CO-flux derived (red) diurnally varying urban CO2 fluxes. Figure 1: Land cover (from aerial photography), with highlighted commuter axes (light blue & red). Inset shows picture of (60-m) tower installations. CONCLUSIONS Data presented were obtained from micrometeorological installations at a tall lattice communications tower located at the Houston Yellow Cab headquarters, approximately 4 km north of downtown. A sonic anemometer extends southward from the tower at 60 m above ground level. We intake air for flux measure-ments via a 9.5 mm OD Teflon PFA tube located next to the sonic anemometer. CO2 and water vapor mixing ratios were measured by a LI7000 instrument (9-s delay), calibrated weekly. CO and its gradient (40-60 m) was measured by a 2006 model 48CTL gas filter correlation analyzer, also calibrated weekly. Our location is unique, as it contains a variety of different land covers within the tower’s footprint region. The tower is centered in an older, mostly residential area with industrial and commercial buildings as well as major roads and highways in close proximity to the measurement site (Figure 1). Urban vegetation is dominated by mature trees, with slight differences in density (particularly for easterlies) with wind direction. Figure 7: CO/CO2 emission ratio distribution ob- tained from strong morning rush-hour correlations. • Extrapolation from CO appears to underestimate • the net CO2 flux, showing that either CO-flux is • underestimated or other than car-traffic sources • contribute significantly • The sum of the biogenic and anthropogenic CO2 • fluxes inferred from quadrant analysis appears to • be only slightly biased compared to net fluxes • Future improvements are sought via varying the • the hole size, and using upscaled traffic count and • natural gas use data, as well as modeling soil and • plant respiration and photosynthesis. Figure 5: Monthly biogenic (green) and anthropogenic (red) CO2 flux variability. Thresholds of u* > 0.2 m s-1, and >100 (bio) or >500 (anthro) data points were used. A noticeably stronger biogenic flux contribution can be seen at the arrival of the spring months as plants become more active (Figure 5). A peak biogenic flux contribution in the late morning to early afternoon is visible for all months. There are no obvious peaks in the anthropogenic flux contribution but a small late afternoon rush hour peak is discernable. Figure 3: Quadrant plot in c’T’ space from 13:00 to 13:30 h on July 14, 2008. The red points indicate up- drafts outside of a hyperbole with H = 0.25. References Thomas et al. (2008): Estimating daytime subcanopy respiration from conditional sampling methods applied to multi-scalar high frequency turbulence time series. Agric. For. Meteorol. 148: 1210-1229 Figure 8: Calculated (MO-theory) CO flux dependence on wind direction.