Download
1 / 28
280 likes | 419 Vues
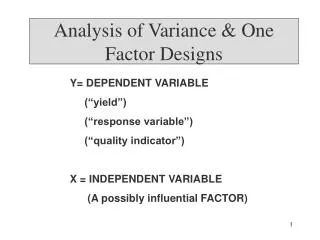
One-Factor Analysis of Variance. A method to compare two or more (normal) population means. Does distance it takes to stop car at 60 mph depend on tire brand ?. Brand1 Brand2 Brand3 Brand4 Brand5 194 189 185 183 195 184 204 183 193 197 189 190 186 184 194

E N D
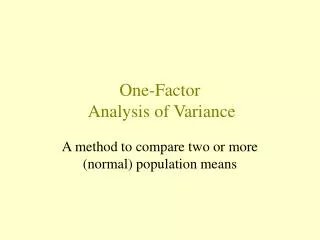
One-Factor Analysis of Variance A method to compare two or more (normal) population means
Does distance it takes to stop car at 60 mph depend on tire brand? • Brand1 Brand2 Brand3 Brand4 Brand5 • 194 189 185 183 195 • 184 204 183 193 197 • 189 190 186 184 194 • 189 190 183 186 202 • 188 189 179 194 200 • 186 207 191 199 211 • 195 203 188 196 203 • 186 193 196 188 206 • 183 181 189 193 202 • 188 206 194 196 195
Sample descriptive statistics Brand N MEAN SD 1 10 188.20 3.88 2 10 195.20 9.02 3 10 187.40 5.27 4 10 191.20 5.55 5 10 200.50 5.44
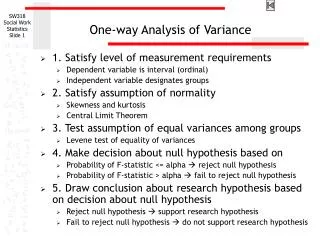
Hypotheses • The null hypothesis is that the group population means are all the same. That is: • H0: 1 = 2 = 3 = 4 = 5 • The alternative hypothesis is that at least one group population mean differs from the others. That is: • HA: at least one i differs from the others
Analysis of Variance Analysis of Variance for comparing all 5 brands Source DF SS MS FP Brand 4 1174.8 293.7 7.95 0.000 Error 45 1661.7 36.9 Total 49 2836.5 The P-value is small (0.000, to three decimal places), so reject the null hypothesis. There is sufficient evidence to conclude that at least one brand is different from the others.
Does learning method affect student’s exam scores? • Consider 3 methods: • standard • osmosis • shock therapy • Convince 15 students to take part. Assign 5 students randomly to each method. • Wait eight weeks. Then, test students to get exam scores.
Suppose … Study #1 Is there a reasonable conclusion?
Suppose … Study #2 Is there a reasonable conclusion?
Suppose … Study #3 Is there a reasonable conclusion?
“Analysis of Variance” The variation between the group means and the grand mean is larger than the variation within the groups.
“Analysis of Variance” The variation between the group means and the grand mean is smaller than the variation within the groups.
Analysis of Variance • A division of the overall variability in data values in order to compare means. • Overall (or “total”) variability is divided into two components: • the variability “between” groups, and • the variability “within” groups • Summarized in an “ANOVA” table.
ANOVA Table for Study #1 “F” means “F test statistic” One-way Analysis of Variance Source DF SS MS F P Factor 2 2510.5 1255.3 93.44 0.000 Error 12 161.2 13.4 Total 14 2671.7 P-Value “Source” means “the source of the variation in the data” “DF” means “the degrees of freedom” “SS” means “the sum of squares” “MS” means “mean sum of squares”
ANOVA Table for Study #1 One-way Analysis of Variance Source DF SS MS F P Factor 2 2510.5 1255.3 93.44 0.000 Error 12 161.2 13.4 Total 14 2671.7 “Factor” means “Variability between groups” or “Variability due to the factor (or treatment) of interest” “Error” means “Variability within groups” or “unexplained random error” “Total” means “Total variation from the grand mean”
General ANOVA Table One-way Analysis of Variance Source DF SS MS F P Factor m-1 SS(Between) MSB MSB/MSE Error n-m SS(Error) MSE Total n-1 SS(Total) From F-distribution with m-1 numerator and n-m denominator d.f. MSB = SS(Between)/(m-1) MSE = SS(Error)/(n-m) n-1 = (m-1) + (n-m) SS(Total) = SS(Between) + SS(Error)
ANOVA Table for Study #1 One-way Analysis of Variance Source DF SS MS F P Factor 2 2510.5 1255.3 93.44 0.000 Error 12 161.2 13.4 Total 14 2671.7 1255.3 = 2510.5/2 13.4 = 161.2/12 14 = 2 + 12 93.44 = 1255.3/13.4 2671.7 = 2510.5 + 161.2
Total sum of squares SS(TO) Definition: Shortcut:
Treatment sum of squares SS(T) Definition: Shortcut:
Error sum of squares SS(E) Definition: Shortcut:
SS(TO) = SS(T) + SS(E) We’ve broken down the TOTAL variation into a component due to TREATMENT and a component due to random ERROR.
ANOVA Table for Study #3 One-way Analysis of Variance Source DF SS MS F P Factor 2 80.1 40.1 0.46 0.643 Error 12 1050.8 87.6 Total 14 1130.9 The P-value is large so we cannot reject the null hypothesis. There is insufficient evidence to conclude that the average exam scores differ for the three learning methods.
One-Way ANOVA with Unstacked Data DATA: IN MINITAB: std1 osm1 shk1 51 58 77 45 68 72 40 64 78 41 63 73 41 62 75 1. Select Stat. 2. Select ANOVA. 3. Select One-way (Unstacked). 4. Select the columns containing the data. 5. If you want boxplots or dotplots of the data, select Graphs... 6. Select OK.
One-Way ANOVA with Stacked Data DATA: Method Score 1 51 1 45 1 40 1 41 1 41 2 58 2 68 2 64 2 63 2 62 3 77 3 72 3 78 3 73 3 75 IN MINITAB: 1. Select Stat. 2. Select ANOVA. 3. Select One-way. 4. Select the “response.” (Score) 5. Select the “factor.” (Method) 5. If you want boxplots or dotplots of the data, select Graphs... 6. Select OK.
Do Holocaust survivors have more sleep problems than others?
ANOVA Table for Sleep Study One-way Analysis of Variance Source DF SS MS F P Factor 2 1723.8 861.9 61.69 0.000 Error 117 1634.8 14.0 Total 119 3358.6