Download
1 / 42
420 likes | 502 Vues
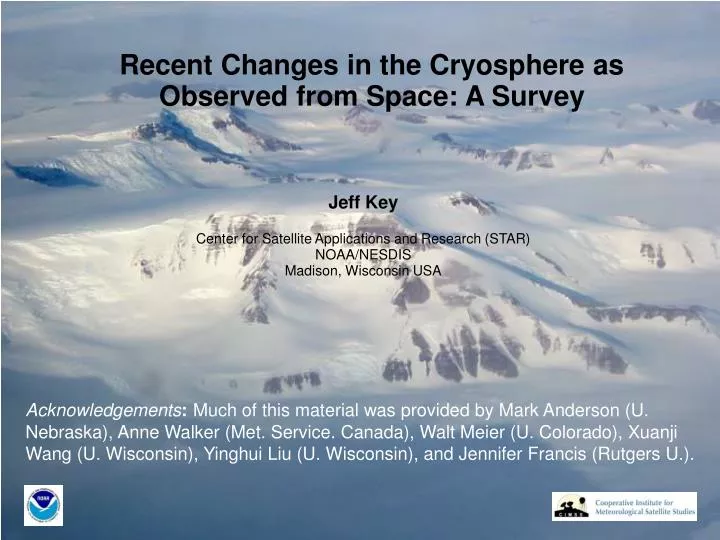
Recent Changes in the Cryosphere as Observed from Space: A Survey. Jeff Key Center for Satellite Applications and Research (STAR) NOAA/NESDIS Madison, Wisconsin USA.

E N D
Recent Changes in the Cryosphere as Observed from Space: A Survey Jeff KeyCenter for Satellite Applications and Research (STAR)NOAA/NESDISMadison, Wisconsin USA Acknowledgements:Much of this material was provided by Mark Anderson (U. Nebraska), Anne Walker (Met. Service. Canada), Walt Meier (U. Colorado), Xuanji Wang (U. Wisconsin), Yinghui Liu (U. Wisconsin), and Jennifer Francis (Rutgers U.).
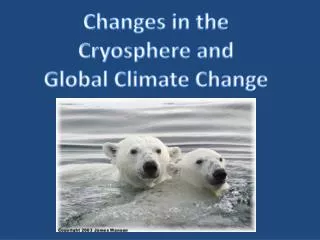
The Cryosphere The term cryosphere collectively describes the elements of the Earth system containing water in its frozen state, and includes sea ice, lake- and river- ice, snow cover, solid precipitation, glaciers, ice caps, ice sheets, permafrost, and seasonally frozen ground. The cryosphere exists at all latitudes and in about one hundred countries. It has profound socio-economic value due to its role in water resources and its impact on transportation, fisheries, hunting, and agriculture. It plays a pivotal role in climate due to its influence on surface energy, moisture, clouds, precipitation, hydrological conditions, and atmospheric and oceanic dynamics. The cryosphere is a sensitive and informative indicator of climate change.
Arctic vs Antarctic • Polar bears vs penguins • Ocean surrounded by land vs land surrounded by ocean
Passive microwave-derived (SMMR / SSM/I) sea ice extent in September, 1979 through 2006. The linear trend is -8.9% per decade.
Trigger + Energy Absorption Snow Melt + Snow Melt Onset Melt onset date signals a transition in the Arctic energy balance
Melt Onset over the Arctic Ocean Julian Day R2=0.50
Winter Snow on ice Summer Open Water Spring Pre-breakup Trends and Variability in Lake Ice Break-up (1979-2005) from Passive Microwave Satellite Data Break-up Freeze-up Great Bear Lake 1997 Great Slave Lake 1998 1999 km 0 250 500 Lake Ice Signals in 37 GHz Brightness Temperature Annual Time Series Mean break-up date = Day 167 (June 16) Standard deviation = 8.1 days Mean break-up date = Day 193 (July 12) Standard deviation = 8.3 days
Snow Cover Passive Microwave Derived Snow Water Equivalent (SWE)
NA snow cover was generally above average in the 70s and 80s, and below average from the late 80s on. Overall, NA snow cover has declined by about 10% since 1972.
Satellite gravity provides direct measurements of ice sheet mass change. Data from the GRACE (Gravity Recovery and Climate Experiment) satellite show that the Greenland Ice Sheet is losing mass at an equivalent rate of sea level rise of about 0.54 mm/yr.
Above: USGS photos of the South Cascade Glacier (Washington) show dramatic retreat. Below: Muir Glacier on August 13, 1941 (left, by William O. Field) and on August 31, 2004, (right, by Bruce F. Molnia, USGS).
Surface Temperature and Cloud Amount from AVHRR Winter Surface Temperature Trend: APP-x (Courtesy R. Stone)
Trends in Low-Level Temperature Inversion Strengthfrom HIRS, 1980-1996 Monthly trend of clear-sky inversion strength (K/year) in November, December, January, February, March, and winter (DJF), 1980-1996, using a 2-channel statistical method.
Heat Advection from TOVS Decadal trends in poleward advective heating in the 500-300 hPa layer (K/day/decade) for each season.
Clues to Sea Ice Variability Using AVHRR and TOVS Percentages of variance (y-axis) in anomalies of sea ice maximum retreat explained by anomalies in zonal wind (U, black), meridional wind (V, blue), downwelling longwave flux (DLF, green), and the convergence of advected sensible heat (ADV, red) in each peripheral sea of the Arctic Ocean. The bars represent explained variance at lags of 0, 10, 25, 50, and 80 days, where the ice edge anomaly lags the forcing anomaly.
Satellite Climatology: Major Findings The loss of Arctic perennial ice cover is almost 10% per decade. (SMMR and SSM/I) The relative roles of advection and radiation vary by region. (TOVS and AVHRR) North America snow cover has decreased by about 10% since 1972. (in situ + SSM/I) Glacier and ice sheet mass balance has decreased over the last few decades. (GRACE, altimeter) Greenland ice sheet melt area has increased by 16% over the last 20 years. (SMMR and SSM/I) If Arctic cloud cover had not been changing over the past two decades, surface temperatures would probably have risen at an even greater rate than what has been observed. (AVHRR) Decreases in sea ice extent and albedo from surface warming modulate the increasing cloud cooling effect, resulting in little or no change in the radiation budget. (AVHRR) The location and strength of the polar vortex has changed over the past two decades, affecting the movement of heat and moisture into/out of the Arctic. (TOVS) The decreasing trend in winter surface temperature over the central Arctic cannot be explained solely by large-scale atmospheric circulation changes. (AVHRR and TOVS) There is a strong coupling between changes in surface temperature and changes in inversion strength, but that trends in some areas may be a result of advection aloft rather than warming/cooling at the surface. (HIRS) Changes in summer albedo over Alaska correlate with a lengthening of the snow-free season that has increased atmospheric heating locally by 3 W/m-2/decade. Current trends in shrub and tree expansion could further amplify this by 2-7 times. (AVHRR + in situ)
What does the future hold? (It’s not so easy to predict)
Arctic Oscillation Positive phase Negative phase There is no accepted theory for the existence of the AO. It may be driven by increasing SST which drives anomalies of tropical convection, which in turn can affect the generation of planetary waves.
Lake - Ice Observations LIAG 1970 n = 234 Courtesy Claude Duguay
Lake - Ice Observations LIAG 1990 n = 132 Courtesy Claude Duguay
Melt over the Queen Elizabeth Islands, 2000-2004 Ice Cap Melt Climatology from QuikSCAT Scatterometer Images. (a) Qscat melt onset dates; (b) freeze-up dates; (c) the number of melt days. Melt was not detected in any of the years in areas shown in white. Numbers in (b) indicate major ice caps (1Devon; 2Manson; 3Sydkap; 4POW; 5Agassiz; 6Axel Heiberg Island; 7Northern Ellesmere Island) Wang, L., et al. 2005. Melt season duration on Canadian Arctic ice caps, 2000-2004. Geophysical Research Letters
Long-term Variability in Snow Cover – Merging of Satellite SWE and Conventional Snow Cover Data Passive Microwave Derived SWE • Brown (J. Climate, 2000) produced a gridded snow extent and water equivalent dataset for North America from historical conventional observations (1915-1992). • SMMR (1978-1987) and SSM/I (1987-present) data standardized using coefficients of Derksen and Walker (2004). • Strong agreement with the passive microwave time series was exhibited for the 1978-1992 overlap period, allowing the satellite record to be viewed within the context of a longer dataset. • Anomalies during the passive microwave era are not more extreme than those in the historical record. • Linear trend analysis provided no evidence of any significant long term trends in either SCA or SWE over the December-March period. *from Derksen et al., 2004, J. Hydrometeorology.