Download
1 / 17
170 likes | 275 Vues

E N D
1. Identification of Link Congestion Dependence Patterns for Dynamic Route Guidance 14th ITS world Congress
Beijing, 2007
2. Outline Here is my presentation outline, it�ll include five parts. First I�d like to give you an introduction on the background of this study. Second, I�ll present you to the problem and our approach to solve the problem. Third, I�ll show you the method of analysis. It�s followed the results. Finally, I�ll recap the main findings and future work in the conclusion. So first, let me give you an introduction of the background of this study. Here is my presentation outline, it�ll include five parts. First I�d like to give you an introduction on the background of this study. Second, I�ll present you to the problem and our approach to solve the problem. Third, I�ll show you the method of analysis. It�s followed the results. Finally, I�ll recap the main findings and future work in the conclusion. So first, let me give you an introduction of the background of this study.
3. Introduction
4. Introduction
5. Introduction Here is an example of in-vehicle display of a BMW. These triangles are representing the current congestion on the network. Now, I�m moving on to our next section, problem formulation and approach Here is an example of in-vehicle display of a BMW. These triangles are representing the current congestion on the network. Now, I�m moving on to our next section, problem formulation and approach
6. Problem formulation
7. Problem formulation Here, first we look at the phenomenon of congestion propagation and dispersion. I present a result of traffic simulation from a city network model. The first diagram shows the traffic condition at the initial link failure. The green represents the normal traffic condition on the link and red means the traffic on that link is highly congested. Traffic is flowing anti-clockwise on the ring road. The second diagram shows the traffic condition after 30 minutes, we can notice that on the congestion almost propagates most of right side network. After 30 minutes, we unblock the initial failed link. And last diagram is the traffic situation after release of the congestion. Here, first we look at the phenomenon of congestion propagation and dispersion. I present a result of traffic simulation from a city network model. The first diagram shows the traffic condition at the initial link failure. The green represents the normal traffic condition on the link and red means the traffic on that link is highly congested. Traffic is flowing anti-clockwise on the ring road. The second diagram shows the traffic condition after 30 minutes, we can notice that on the congestion almost propagates most of right side network. After 30 minutes, we unblock the initial failed link. And last diagram is the traffic situation after release of the congestion.
8. Method of analysis
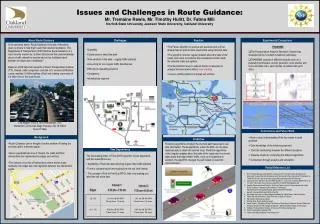
9. Test network The link travel time data is available from the Coventry city (West Midland, England) microsimulation model for this study. The method used in exploring the failure dependent relationship among the links is to hold one link failed and observe the impact on the adjacent links over a period of time. below shows the method of analysis. The failed link is red colored on the left. The impact of this link failure is observed through other adjacent links, especially the subsequent links. The travel time data on each links is generated from microsimulation modelling and decoded into binary variable data to determine the state of the link which is only normal and abnormal state. The congestion propagation patterns could be illustrated by color coded these binary data. The link travel time data is available from the Coventry city (West Midland, England) microsimulation model for this study. The method used in exploring the failure dependent relationship among the links is to hold one link failed and observe the impact on the adjacent links over a period of time. below shows the method of analysis. The failed link is red colored on the left. The impact of this link failure is observed through other adjacent links, especially the subsequent links. The travel time data on each links is generated from microsimulation modelling and decoded into binary variable data to determine the state of the link which is only normal and abnormal state. The congestion propagation patterns could be illustrated by color coded these binary data.
10. Method of analysis
11. Method of analysis
12. Method of analysis
13. Results
14. Results
15. Results
16. Conclusions
17. Q & A ?