Download
1 / 67
670 likes | 792 Vues
The Evolution of Research and Education Networks and their Essential Role in Modern Science. TERENA Networking Conference 2009. William E. Johnston, ESnet Adviser and Senior Scientist

E N D
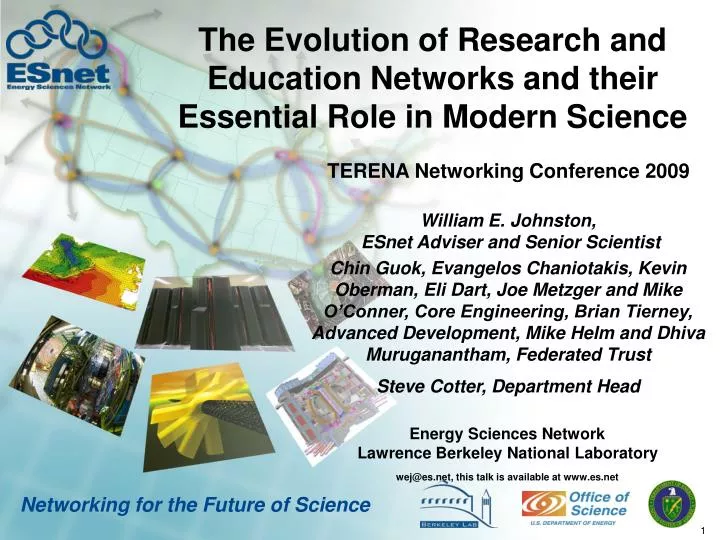
The Evolution of Research and Education Networks and their Essential Role in Modern Science TERENA Networking Conference 2009 William E. Johnston, ESnet Adviser and Senior Scientist Chin Guok, Evangelos Chaniotakis, Kevin Oberman, Eli Dart, Joe Metzger and Mike O’Conner, Core Engineering, Brian Tierney, Advanced Development, Mike Helm and Dhiva Muruganantham, Federated Trust Steve Cotter, Department Head Energy Sciences Network Lawrence Berkeley National Laboratory wej@es.net, this talk is available at www.es.net Networking for the Future of Science
DOE Office of Science and ESnet – the ESnet Mission • The Office of Science (SC) is the single largest supporter of basic research in the physical sciences in the United States, providing more than 40 percent of total funding for US research programs in high-energy physics, nuclear physics, and fusion energy sciences. (www.science.doe.gov) – SC funds 25,000 PhDs and PostDocs • A primary mission of SC’s National Labs is to build and operate very large scientific instruments - particle accelerators, synchrotron light sources, very large supercomputers - that generate massive amounts of data and involve very large, distributed collaborations • ESnet - the Energy Sciences Network - is an SC program whose primary mission is to enable the large-scale science of the Office of Science that depends on: • Sharing of massive amounts of data • Supporting thousands of collaborators world-wide • Distributed data processing • Distributed data management • Distributed simulation, visualization, and computational steering • Collaboration with the US and International Research and Education community • In order to accomplish its mission SC/ASCAR funds ESnet to provide high-speed networking and various collaboration services to Office of Science laboratories
ESnet Approach to Supporting of the Office of Science Mission • The ESnet approach to supporting the science mission of the Office of Science involves i) Identifying the networking implications of scientific instruments, supercomputers, and the evolving process of how science is done ii) Developing approaches to building the network environment that will enable the distributed aspects of SC science, and iii) Continually anticipating future network capabilities that will meet future science requirements • This approach has lead to a high-speed network with highly redundant physical topology, services providing a hybrid packet-circuit network, and certain predictions about future network requirements.
ESnet Defined • A national optical circuit infrastructure • ESnet shares an optical network on a dedicated national fiber infrastructure with Internet2 (US national research and education (R&E) network) • ESnet has exclusive use of a group of 10Gb/s optical channels on this infrastructure • ESnet’s two core networks – IP and SDN – are built on more than 125 10Gb/s WAN circuits • A large-scale IP network • A tier 1 Internet Service Provider (ISP) (direct connections with all major commercial networks providers – “default free” routing) • A large-scale science data transport network • With multiple 10Gb/s connections to all major US and international research and education (R&E) networks in order to enable large-scale science • Providing virtual circuit services specialized to carry the massive science data flows of the National Labs • A WAN engineering support group for the DOE Labs • An organization of 35 professionals structured for the service • The ESnet organization designs, builds, and operates the ESnet network based mostly on “managed wave” services from carriers and others • An operating entity with an FY08 budget of about $30M • 60% of the operating budget is for circuits and related, remainder is staff and equipment related
ESnet Provides Global High-Speed Internet Connectivity for DOE Facilities and Collaborators (12/2008) SINet (Japan) Russia (BINP) CERN/LHCOPN (USLHCnet:DOE+CERN funded) GÉANT in Vienna (via USLHCNet circuit) GÉANT - France, Germany, Italy, UK, etc PacWave StarlightUSLHCNetNLR PacWave Internet2NYSERNetMAN LAN BNL AOFA NEWY BOST Internet2 DOE GTNNNSA Internet2 KAREN / REANNZ Transpac2 Internet2 Korea (kreonet2) SINGAREN Japan (SINet) ODN Japan Telecom America CHIC CLEV HOUS KANS LASV SUNN DENV SUNN JLAB Equinix ICCN Equinix IU GPop SNV1 SNLA LANL DOE-ALB WASH NASAAmes PANTEX NOAA ORAU OSTI LOSA NSF/IRNCfunded USHLCNet to GÉANT GA SDSC Allied Signal BOIS NASH ALBU R&Enetworks CA*net4 AMPATHCLARA (S. America) ATLA UNM SOX CUDI(S. America) ELPA Japan (SINet) Australia (AARNet) Canada (CA*net4 Taiwan (TANet2) Singaren Transpac2 CUDI KAREN/REANNZ ODN Japan Telecom America NLR-Packetnet Internet2 Korea (Kreonet2) CA*net4 France GLORIAD (Russia, China)Korea (Kreonet2 MREN StarTapTaiwan (TANet2, ASCGNet) SEAT AU PNNL CHI-SL MIT/PSFC LIGO INL Salt Lake Lab DC Offices FNAL LVK NERSC LLNL ANL PPPL SNLL JGI GFDL FRGPop DOE LBNL PU Physics AMES NETL SLAC NREL PAIX-PA Equinix, etc. IARC ORNL MAXGPoP NLR Internet2 YUCCA MT KCP NSTEC BECHTEL-NV ARM UCSD Physics SRS AU ~45 end user sites International (10 Gb/s) 10 Gb/s SDN core (I2, NLR) 10Gb/s IP core MAN rings (10 Gb/s) Lab supplied links OC12 / GigEthernet OC3 (155 Mb/s) 45 Mb/s and less Office Of Science Sponsored (22) NNSA Sponsored (13+) Joint Sponsored (4) • Much of the utility (and complexity) of ESnet is in its high degree of interconnectedness Other Sponsored (NSF LIGO, NOAA) Laboratory Sponsored (6) Specific R&E network peers commercial peering points Geography isonly representational Other R&E peering points ESnet core hubs
Current and Historical ESnet Traffic Patterns • ESnet Traffic Increases by10X Every 47 Months, on Average Apr 2006 1 PBy/mo. Nov 2001 100 TBy/mo. July 2010 10 PBy/mo. Jul 1998 10 TBy/mo. 53 months Oct 1993 1 TBy/mo. Terabytes / month Aug 1990 100 MBy/mo. 40 months 57 months 38 months Log Plot of ESnet Monthly Accepted Traffic, January 1990 – December 2008
Most of ESnet’s traffic (>85%) goes to and comes from outside of ESnet. This reflects the highly collaborative nature of the large-scale science of DOE’s Office of Science. = the R&E source or destination of ESnet’s top 100 traffic generators / sinks, all of which are research and education institutions (the DOE Lab destination or source of each flow is not shown)
The Operational Challenge 1625 miles / 2545 km 2750 miles / 4425 km The relatively large geographic ESnet scale of makes it a challenge for a small organization to build, maintain, and operate the network.
How ESnet Determines its Network Architecture, Services, and Bandwidth Requirements are determined by 1) Observing current and historical network traffic patterns What do the trends in network patterns predict for future network needs? 2) Exploring the plans and processes of the major stakeholders (the Office of Science programs, scientists, collaborators, and facilities): 1a) Data characteristics of scientific instruments and facilities What data will be generated by instruments and supercomputers coming on-line over the next 5-10 years? 1b) Examining the future process of science How and where will the new data be analyzed and used – that is, how will the process of doing science change over 5-10 years?
Observing the Network: A small number of large data flows now dominate the network traffic – this is one motivator for virtual circuits as a key network service 3.5 PBytes in March 2008 ESnet Monthly Accepted Traffic, TBy/mo, January 2000 – April 2008 2.7 PBytes in July 2007 1 PBytes in April 2006 Starting in mid-2005 a small number of large data flows dominate the network traffic Red bars = top 100 site to site workflowsNote: as the fraction of large flows increases, the overall traffic increases become more erratic – it tracks the large flows Note: top 100 data only available to mid-2006 Overall traffic tracks the very large science use of the network FNAL (LHC Tier 1site) Outbound Traffic (courtesy Phil DeMar, Fermilab)
Most of the Large Flows Exhibit Circuit-like Behavior • LIGO – CalTech (host to host) flow over 1 year • The flow / “circuit” duration is about 3 months Gigabytes/day (no data)
Most of the Large Flows Exhibit Circuit-like Behavior • SLAC - IN2P3, France (host to host) flow over 1 year • The flow /“circuit” duration is about 1 day to 1 week Gigabytes/day (no data)
Requirements from Observing Traffic Flow Trends • ESnet must have an architecture and strategy that allows scaling of the bandwidth available to the science community by a facto of 10x every 3-4 years • Most ESnet traffic has a source or sink outside of ESnet • Drives requirement for high-bandwidth peering • Reliability and bandwidth requirements demand that peering be redundant • 10 Gbps peerings must be able to be added flexibly, quickly, and cost-effectively • Large-scale science is now the dominant user of the network and this traffic is circuit-like (long duration, same source/destination) • Will consume 95% of ESnet bandwidth • Since large-scale science traffic is the dominant user of the network, and the network must be architected to serve large-scale science as a first consideration • Traffic patterns are very different than commodity Internet – the “flows” are circuti-like and vastly greater than all commodity traffic • Even apart from user services requirements, large-scale science traffic inherently exhibits circuit-like behavior • This circuit-like behavior of the large flows of science data requires ESnet to be able to do traffic engineering to optimize the use of the network
Exploring the plans of the major stakeholders Primary mechanism is Office of Science (SC) network Requirements Workshops, which are organized by the SC Program Offices; Two workshops per year - workshop schedule, which repeats in 2010 Basic Energy Sciences (materials sciences, chemistry, geosciences) (2007 – published) Biological and Environmental Research (2007 – published) Fusion Energy Science (2008 – published) Nuclear Physics (2008 – published) IPCC (Intergovernmental Panel on Climate Change) special requirements (BER) (August, 2008) Advanced Scientific Computing Research (applied mathematics, computer science, and high-performance networks) (Spring 2009) High Energy Physics (Summer 2009) Workshop reports: http://www.es.net/hypertext/requirements.html The Office of Science National Laboratories (there are additional free-standing facilities) include Ames Laboratory Argonne National Laboratory (ANL) Brookhaven National Laboratory (BNL) Fermi National Accelerator Laboratory (FNAL) Thomas Jefferson National Accelerator Facility (JLab) Lawrence Berkeley National Laboratory (LBNL) Oak Ridge National Laboratory (ORNL) Pacific Northwest National Laboratory (PNNL) Princeton Plasma Physics Laboratory (PPPL) SLAC National Accelerator Laboratory (SLAC)
Science Network Requirements Aggregation Summary Note that the climate numbers do not reflect the bandwidth that will be needed for the4 PBy IPCC data setsshown in the Capacity comparison graph below
Science Network Requirements Aggregation Summary Immediate Requirements and Drivers for ESnet4
Bandwidth – Path RequirementsMapping to the Network for the 2010 Network (Based only on LHC, RHIC, and Supercomputer Stated Requirements and Traffic Projections) ESnet IP core ESnet Science Data Network core (N X 10G) ESnet SDN core, NLR links (backup paths) Lab supplied link LHC related link MAN link International IP Connections ESnet SDN switch hubs Layer 1 optical nodes not currently in ESnet plans Layer 1 optical nodes - eventual ESnet Points of Presence LHC/CERN 45 Seattle 50 40 PNNL 20 15 Port. USLHC MAN LAN(AofA) Boston Boise USLHC StarLight Chicago Clev. Sunnyvale Phil Denver NYC BNL KC SLC Pitts. Wash. DC 10 FNAL 5 LLNL 20 ORNL Las Vegas LANL Tulsa 5 LA Nashville Albuq. GA Science Data Network is 2-5 10G optical circuits per path, depending on location SDSC ? Atlanta 20 20 5 San Diego El Paso ESnet IP switch/router hubs 20 BatonRouge Houston Lab site Lab site – independent dual connect. Committed path capacity, Gb/s XX
Are These Estimates Realistic? Yes. 10 9 8 7 6 5 4 3 2 1 0 FNAL outbound CMS traffic for 4 months, to Sept. 1, 2007Max= 8.9 Gb/s (1064 MBy/s of data), Average = 4.1 Gb/s (493 MBy/s of data) Gigabits/sec of network traffic Megabytes/sec of data traffic Destinations:
Do We Have the Whole Picture? • However – is this the whole story? (No) • More later ……
Strategy I) Provide the basic, long-term bandwidth requirements with an adequate and scalable infrastructure • ESnet4 was built to address specific Office of Science program requirements. The result is a much more complex and much higher capacity network. • ESnet3 2000 to 2005: • A routed IP network with sites singly attached to a national core ring • Very little peering redundancy • ESnet4 in 2008: • The new Science Data Network (blue) uses MPLS to provide virtual circuits with guaranteed bandwidth for large data movement • The large science sites are dually connected on metro area rings or dually connected directly to core ring for reliability • Rich topology increases the reliability and flexibility of the network
2012 Planned ESnet4 1625 miles / 2545 km Production IP core (10Gbps) SDN core (20-30-40-50 Gbps) MANs (20-60 Gbps) or backbone loops for site access International connections Primary DOE Labs High speed cross-connectswith Internet2 Possible hubs 2750 miles / 4425 km Core networks 50-60 Gbps by 2009-2010 (10Gb/s circuits),200+ Gbps by 2011-2012 (some 100 Gb/s circuits) Canada (CANARIE) CERN(30+ Gbps) Canada (CANARIE) Asia-Pacific Asia Pacific CERN(30+ Gbps) GLORIAD(Russia and China) USLHCNet Europe (GEANT) Asia-Pacific Science Data Network Core Seattle Boston Chicago IP Core Boise Australia New York Kansas City Cleveland Denver Washington DC Sunnyvale Las Vegas Atlanta Tulsa LA Albuquerque Australia South America (AMPATH) San Diego Houston South America (AMPATH) IP core hubs Jacksonville SDN hubs Core network fiber path is~ 14,000 miles / 24,000 km
Strategy II) A Service-Oriented Virtual Circuit Service Multi-Domain Virtual Circuits as a Service – “OSCARS” – ESnet’s InterDomain Controller Service Characteristics: Guaranteed bandwidth with resiliency User specified bandwidth - requested and managed in a Web Services framework Explicit backup paths can be requested Traffic isolation Allows for high-performance, non-standard transport mechanisms that cannot co-exist with commodity TCP-based transport Traffic engineering (for ESnet operations) Enables the engineering of explicit paths to meet specific requirements e.g. bypass congested links; using higher bandwidth, lower latency paths; etc. Secure connections The circuits are “secure” to the edges of the network (the site boundary) because they are managed by the control plane of the network which is highly secure and isolated from general traffic End-to-end, cross-domain connections between Labs and collaborating institutions
Environment of Science is Inherently Multi-Domain Inter-domain interoperability is crucial to serving science An effective international R&E collaboration has standardized inter-domain (inter-IDC) control protocol – “IDCP” (ESnet, Internet2, GÉANT, USLHCnet, several European NRENs, etc.) In order to set up end-to-end circuits across multiple domains: The domains exchange topology information containing at least potential VC ingress and egress points VC setup request (via IDCP protocol) is initiated at one end of the circuit and passed from domain to domain as the VC segments are authorized and reserved Topology exchange VC setup request Local InterDomain Controller VC setup request VC setup request Local IDC Local IDC VC setup request A Z Local IDC Local IDC GEANT (AS20965) [Europe] DESY (AS1754) [Germany] FNAL (AS3152) [US] DFN (AS680) [Germany] End-to-endvirtual circuit Example ESnet (AS293) [US]
OSCARS Services Overview • InterDomain Controller components: • Public Web proxy – the public access interface (to keep all non-ESnet communication out of the ESnet security domain) • WBUI – authentication and authorization interface • AAAS – moderate access, enforce policy, and generate usage records • NS – subscription based event notification • PSS setup and teardown the on-demand paths (LSPs) User Other InterDomain Controllers User App Source ESnet Public WebServer (Proxy) IP Link SDN IP WBUI Web Based User Interface Notification Call-back Event API SDN Link Notification Broker API Resv API WS Interface SDN IP ESnet WAN • OSCARS Core • Reservation Management • Path Computation • Scheduling • Inter-Domain Communications • PSS • Path Setup Subsystem • Network Element Interface NS NotificationSubsystem SDN IP IP Link SDN Link Sink AAAS Authentication Authorization Auditing Subsystem HTTPS HTTPS (SOAP) RMI SSHv2 OSCARS initiated ESnet InterDomain Controller (OSCARS) ESnet security domain
OSCARS is a production service in ESnet 10 FNAL Site VLANS OSCARS setup all VLANs ESnet PE ESnet Core USLHCnet (LHC OPN) VLAN USLHCnet VLANS USLHCnet VLANS USLHCnet VLANS USLHCnet VLANS Tier2 LHC VLANS Tier2 LHC VLANS T2 LHC VLAN Automatically generated map of OSCARS managed virtual circuits E.g.: FNAL – one of the US LHC Tier 1 data centers. This circuit map (minus the yellow callouts that explain the diagram) is automatically generated by an OSCARS tool and assists the connected sites with keeping track of what circuits exist and where they terminate.
Strategy III: Monitoring as aService-Oriented Communications Service • perfSONAR is a community effort to define network management data exchange protocols, and standardized measurement data gathering and archiving • Widely used in international and LHC networks • The protocol is based on SOAP XML messages and follows work of the Open Grid Forum (OGF) Network Measurement Working Group (NM-WG) • Has a layered architecture and a modular implementation • Basic components are • the “measurement points” that collect information from network devices (actually most anything) and export the data in a standard format • a measurement archive that collects and indexes data from the measurement points • Other modules include an event subscription service, a topology aggregator, service locator (where are all of the archives?), a path monitor that combines information from the topology and archive services, etc. • Applications like the traceroute visualizer and E2EMON (the GÉANT end-to-end monitoring system) are built on these services
perfSONAR Architecture m1 m2 m1 m4 m3 m3 layer architectural relationship examples • real-time end-to-end performance graph (e.g. bandwidth or packet loss vs. time) • historical performance data for planning purposes • event subscription service (e.g. end-to-end path segment outage) client (e.g. part of an application system communication service manager) human user performance GUI interface path monitor event subscription service service locator topology aggregator service measurementarchive(s) measurement export measurement export measurement export • The measurement points (m1….m6) are the real-time feeds from the network or local monitoring devices • The Measurement Export service converts each local measurement to a standard format for that type of measurement measurement point m1 m6 m5 m3 network domain 2 network domain 3 network domain 1
Traceroute Visualizer • Multi-domain path performance monitoring is an example of a tool based on perfSONAR protocols and infrastructure • provide users/applications with the end-to-end, multi-domain traffic and bandwidth availability • provide real-time performance such as path utilization and/or packet drop • One example – Traceroute Visualizer[TrViz] – has been deployed in about 10 R&E networks in the US and Europe that have deployed at least some of the required perfSONAR measurement archives to support the tool
Traceroute Visualizer • Forward direction bandwidth utilization on application path from LBNL to INFN-Frascati (Italy) (2008 SNAPSHOT) • traffic shown as bars on those network device interfaces that have an associated MP services (the first 4 graphs are normalized to 2000 Mb/s, the last to 500 Mb/s) 1 ir1000gw (131.243.2.1) 2 er1kgw 3 lbl2-ge-lbnl.es.net 4 slacmr1-sdn-lblmr1.es.net (GRAPH OMITTED) 5 snv2mr1-slacmr1.es.net (GRAPH OMITTED) 6 snv2sdn1-snv2mr1.es.net 7 chislsdn1-oc192-snv2sdn1.es.net (GRAPH OMITTED) 8 chiccr1-chislsdn1.es.net 9 aofacr1-chicsdn1.es.net (GRAPH OMITTED) 10 esnet.rt1.nyc.us.geant2.net (NO DATA) 11 so-7-0-0.rt1.ams.nl.geant2.net (NO DATA) 12 so-6-2-0.rt1.fra.de.geant2.net (NO DATA) 13 so-6-2-0.rt1.gen.ch.geant2.net (NO DATA) 14 so-2-0-0.rt1.mil.it.geant2.net (NO DATA) 15 garr-gw.rt1.mil.it.geant2.net (NO DATA) 16 rt1-mi1-rt-mi2.mi2.garr.net 17 rt-mi2-rt-rm2.rm2.garr.net (GRAPH OMITTED) 18 rt-rm2-rc-fra.fra.garr.net (GRAPH OMITTED) 19 rc-fra-ru-lnf.fra.garr.net (GRAPH OMITTED) 20 21 www6.lnf.infn.it (193.206.84.223) 189.908 ms 189.596 ms 189.684 ms link capacity is also provided (GARR was s front-runner in deploying perfSONAR)
ESnet PerfSONAR Deployment Activities • ESnet is deploying OWAMP and BWCTL servers next to all backbone routers, and at all 10Gb connected sites • 31 locations deployed • Full list of active services at: • http://www.perfsonar.net/activeServices/ • Instructions on using these services for network troubleshooting: • http://fasterdata.es.net • These services have already been extremely useful to help debug a number of problems • perfSONAR is designed to federate information from multiple domains • provides the only tool that we have to monitor circuits end-to-end across the networks from the US to Europe • PerfSONAR measurement points are deployed at dozens of R&E institutions in the US and more in Europe • See https://dc211.internet2.edu/cgi-bin/perfAdmin/serviceList.cgi • The value of perfSONAR increases as it is deployed at more sites
ESnet Status as of 12/2008 • ESnet is set to provide bandwidth and connectivity adequate for all know uses of the network, including the LHC, for the next several years • There is adequate capacity in the metro area networks that connect the LHC Tier1 Data Centers to get LHC data to the core network • There is adequate capacity in all national core paths • There is full redundancy of connections to the Tier 1 centers • There is adequate capacity and redundancy in the connections to the US R&E networks serving the university community in order to get data to the Tier 2 and 3 sites at the maximum rates that have been observer (which is substantially higher than the HEP planning documents indicate) • There is adequate capacity and redundancy in the connections to the international R&E networks serving traffic to and from the European Tier 1 and Tier 2 centers and visa versa (this is apart from the LHCOPN Tier 0 to Tier 1 capacity provided by USLHCNet) • There is a functioning and capable virtual circuit service providing guaranteed bandwidth (primarily from the US Tier 1 to Tier 2 centers, but also from US Tier 1 to European Tier 2 centers)
What Does the Situation Look Like Now?Re-evaluating the Strategy and Identifying Issues • The current strategy (that lead to the ESnet4, 2012 plans) was developed primarily as a result of the information gathered in the 2003 and 2004 network workshops, and their updates in 2005-6 (including LHC, climate simulation, RHIC (heavy ion accelerator), SNS (neutron source), magnetic fusion, the supercomputers, and a few others) [workshops] • So far the more formal requirements workshops have largely reaffirmed the ESnet4 strategy developed earlier • However – is this the whole story*? (No) (* Details may be found in "The Evolution of Research and Education Networks and their Essential Role in Modern Science.” November, 2008. To be published in Trends in High Performance & Large Scale Computing, Lucio Gandinetti and Gerhard Joubert editors. Available at http://www.es.net/pub/esnet-doc/index.html)
Is ESnet Planned Capacity Adequate? E.g. for LHC and climate?(Maybe So, Maybe Not) – Must undertake continuous reexamination of the long-term requirements because they frequently change • Several Tier2 centers (mostly at Universities) are capable of 10Gbps now • Many Tier2 sites are building their local infrastructure to handle 10Gbps • We won’t know for sure what the “real” load will look like until the testing stops and the production analysis begins • Scientific productivity will follow high-bandwidth access to large data volumes incentive for others to upgrade • Many Tier3 sites are also building 10Gbps-capable analysis infrastructures – this was not in LHC plans a year ago • Most Tier3 sites do not yet have 10Gbps of network capacity • It is likely that this will cause a “second onslaught” in 2009 as the Tier3 sites all upgrade their network capacity to handle 10Gbps of LHC traffic • It is possible that the USA installed base of LHC analysis hardware will consume significantly more network bandwidth than was originally estimated • N.B. Harvey Newman (HEP, Caltech) predicted this eventuality several years ago • The needs of the climate modeling community are just emerging (and were not predicted in the requirements studies) and based on data set size are likely to equal those of the LHC • ITER is not accounted for at all
Predicting the Future • How might we “predict” the future without relying on the practitioner estimates given in the requirements workshops? • Consider what we know – not just about historical traffic patterns, but also look at data set size growth • The size of data sets produced by the science community has been a good indicator of the network traffic that was generated • The larger the experiment / science community the more people that are involved at diverse locations and the more that data must move between them
Network Traffic, Science Data, and Network Capacity Ignore the units of the quantities being graphed they are normalized to 1 in 1990, just look at the long-term trends: All of the “ground truth” measures are growing significantly faster than ESnet projected capacity based on stated requirements Projection 2010 value -- 40 PBy -- 4 PBy Historical Climate model data All Four Data Series are Normalized to “1” at Jan. 1990 ESnet traffic HEP experiment data ESnet capacity roadmap (HEP data courtesy of Harvey Newman, Caltech, and Richard Mount, SLAC. Climate data courtesy Dean Williams, LLNL, and the Earth Systems Grid Development Team.)
Issues for the Future Network • The significantly higher exponential growth of science dataset size vs. total capacity (aggregate core bandwidth) means traffic will eventually overwhelm the capacity – “when” cannot be directly deduced from aggregate observations, but if you add this fact • Nominal average load on busiest backbone paths in June 2006 was ~1.5 Gb/s - In 2010 average load will be ~15 Gbps based on current trends and 150 Gb/s in 2014 My (wej) guess is that capacity problems will develop by 2015-16 without new technology approaches
Where Do We Go From Here? • It seems clear that ESnet in the future will have to have both • capacity well beyond the 2004-6 projections, and • the ability to more flexibly map traffic to waves (traffic engineering in order to make optimum use of the available capacity) • To obtain more capacity ESnet will have to go to 100Gb/s waves as there is not enough wave capacity to satisfy newly projected needs by just adding more 10Gb/s waves on the current fiber and it does not appear feasible to obtain a second national fiber footprint
1) Optimize the use of the existing infrastructure Dynamic Wave / Optical Circuit Management: The current path/wave/optical circuit topology is rich in redundancy The current wave transport topology is essentially static or only manually configured - our current network infrastructure of routers and switches assumes this With completely flexible traffic management extending down to the optical transport level we should be able to extend the life of the current infrastructure by moving significant parts of the capacity to the specific routes where it is needed We must integrate the optical transport with the “network” and provide for dynamism / route flexibility at the optical level in order to make optimum use of the available capacity
2) 100Gb/s Waves • ESnet is actively involved in the development and deployment of 100Gb/s per channel optical transport equipment and 100Gb/s routing equipment • ESnet has received special funding (almost $US 60M!) to build a national 100G/wave testbed • The testbed will connect (at least) the three Office of Science supercomputers involved in climate modeling (Argonne – near Chicago, IL; Oak Ridge – east of Nashville, Tennessee; NERSC – Berkeley, CA) • Two other major players in US climate modeling are Lwarence Livermore Lab – east of Berkeley, CA, and NCAR (National Center for Atmospheric Research, Boulder, Colorado) may be added later if the initial testbed is successful in driving 100G component cost down • See Steve Cotter’s talk (“ESnet’s Approach to Enabling Virtual Science”) in session 2A – “Support infrastructure – ‘All change – introducing GN3 and ESNET4’”
Federated Trust Services – Support for Large-Scale Collaboration Remote, multi-institutional, identity authentication is critical for distributed, collaborative science in order to permit sharing widely distributed computing and data resources, and other Grid services Public Key Infrastructure (PKI) is used to formalize the existing web of trust within science collaborations and to extend that trust into cyber space The function, form, and policy of the ESnet trust services are driven entirely by the requirements of the science community and by direct input from the science community International scope trust agreements that encompass many organizations are crucial for large-scale collaborations ESnet has lead in negotiating and managing the cross-site, cross-organization, and international trust relationships to provide policies that are tailored for collaborative science This service, together with the associated ESnet PKI service, is the basis of the routine sharing of HEP Grid-based computing resources between US and Europe
ESnet Public Key Infrastructure ESnet root CA • CAs are provided with different policies as required by the science community • DOEGrids CA has a policy tailored to accommodate international science collaboration • NERSC CA policy integrates CA and certificate issuance with NIM (NERSC user accounts management services) • FusionGrid CA supports the FusionGrid roaming authentication and authorization services, providing complete key lifecycle management DOEGrids CA NERSC CA FusionGrid CA …… CA See www.doegrids.org
DOEGrids CA (Active Certificates) Usage Statistics * Report as of Feb 29, 2009
DOEGrids CA Usage - Virtual Organization Breakdown OSG Includes (BNL, CDF, CIGI,CMS, CompBioGrid, DES, DOSAR, DZero, Engage, Fermilab,GADU, geant4, GLOW, GPN, GRASE GUGrid, i2u2, ILC, JLAB, LIGO, mariachi, MIS, nanoHUB, NWICG, NYSGrid, OSG, OSGEDU, SBGrid, SLAC, STAR & USATLAS)