Download
1 / 16
160 likes | 303 Vues
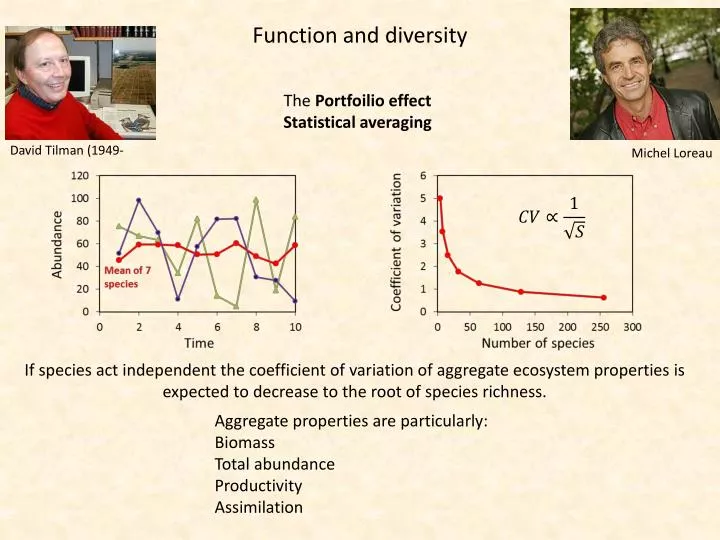
Function and diversity. The Portfoilio effect Statistical averaging. David Tilman (1949-. Michel Loreau. If species act indepe n dent the coefficient of variation of aggregate ecosystem properties is expected to decrease to the root of species richness.

E N D
Function and diversity The Portfoilio effect Statistical averaging David Tilman (1949- Michel Loreau If species act independent the coefficient of variation of aggregate ecosystem properties is expected to decrease to the root of species richness. Aggregate properties are particularly: Biomass Total abundance Productivity Assimilation
The law of the minimum and ecosystem functioning Average performance withoutlimitingeffects Performance with limitingeffects Species at minimum limit the functioning of ecosystem properties Ecosystem functioning increases non-lineary with species richness. Point of fast change Point of fast change This model works if species form functional guilds whose members have equivalent properties.
The law of the minimum Limiting factors: Light Water Space Nutrients Justus von Liebig (1803-1873) Water is the limiting factor for photosynthetic rates with respect to temperature Euryoecious organisms tolerate a wider range of habitat conditions. Stenoecious organisms have limited tolerance. Photosynthetic activity Precipitation Temperature
60 100 50 80 40 60 Total plant cover (%) Total plant cover (%) 30 40 20 y = 12.8Ln(x) + 11.5 20 y = 28.6Ln(x) - 10.7 10 2 R = 0.96 2 R = 0.77 0 0 0 10 20 0 10 20 Number of species Number of species LTER – Long term ecologicalresearchatCedarCreek, Minnesota Variance and covariance of native savannah plants at Cedar Creek in relation to species diversity. 147 experimental plots at Cedar Creek in Minnesota 120 samples from undisturbed native Minnesota grasslands. Tilman 1999, Ecology 80: 1455-1474
Results of the BIODEPTH experiment Grassland aboveground biomass depends on several factors among whichlocality, diversity and functional diversity are of major importance. Hector et al. 1999, Science 286, 1123-1127 Grassland productivity declines as the number of functional groups decreases.
Biodiversity and bacterial activity Day 0-7 Day 7-14 28 days experimental time Day 14-28 Bell et al. 2005, Nature 436: 1157-1160 Bacterial species richness influences respiration of soils from beech stands. Respiration is not a linear function of bacterial richness This points to the existence of redundant species
The current state of art: • Ecosystem functioning depends not such much on species richness but on richness of functional groups (ecologigal guilds) • Productivity increases with plant functional group richness • Stability increases with plant functional group richness • Drought restistance increase with plant functional group richness • Bacterial species richness promotes efficiency of bacterial services like breakdown of pollutants • Decomposition increases with eukaryotic species richness • Total bacterial activity increases with bacterial foodweb complexity • Stability decreases with dispersal among patches • Habitat fragmentation and species richness act synergistically and decrease stability
How do diversity and stability depend on productivity? Speciesrichnesspeaksoftenatintermediateproductivity
250 Palearctic birds 200 150 S 100 50 0 0 500 1000 1500 Evapotranspiration 250 Palearctic butterflies 200 150 S 100 50 0 0 500 1000 1500 Evapotranspiration Evapotranspiration is the sum of evaporation and transpiration, hence the total amount of water going from living organismas and the soil into the atmosphere. It is a measure of total energy input. Hawkins et al. 2003, Ecology 84: 3105-3117 Species richness often peaks at intermediate degrees of evapotransiration.
Hawkins et al. 2003, Ecology 84: 3105-3117 Bird species numbers are correlated with annual evapotranspiration and temperature.
The influence of productivity on the species richness of plants Meta-analysis found very variable patterns of the productivity species richness relationship at local scales. Above the local scale plant species richness increases with productivity. Gillman, Wright, 2006, Ecology 87: 1234-1243
Patterns of fish species richness in China’s lakes Zhao et al. 2006, Gl. Ecol. Biogeogr.
140 140 2 2 R = 0.75 R = 0.34 120 120 100 100 80 80 S S 60 60 40 40 20 20 0 0 1 10 100 1000 10000 1 10 100 1000 Altitude [m] Maximum depth [m] 140 140 120 120 100 100 80 80 S S 60 60 40 40 20 20 0 0 0.001 0.1 10 1000 0.1 10 1000 100000 8 3 2 Lake volume [10 m ] Lake area [km ] Fish speciesrichnessscalessignificantly with altitude and maximum depth of a lake Lake volumeis of minor importance
1000 1000 2 2 R = 0.43 R = 0.57 100 100 S S 10 10 1 1 -10 0 10 20 30 0 500 1000 1500 Annual potential Mean annual temperature evapotranspiration [mm] 1000 1000 2 2 R = 0.53 R = 0.40 100 100 S S 10 10 1 1 0 500 1000 0 500 1000 1500 2000 Annual actual Annual precipitation [mm] evapotranspiration [mm] Main determinants of fish species richness were annual PET, altitude, and lake area.
Productivity and stability Are tropical populations more stable than populations in temperate or arctic regions? There is no general latitudinal trend in population variability Vazquez, Stevens, 2004, Am. Nat 164: E1-E19