Download
1 / 34
340 likes | 485 Vues
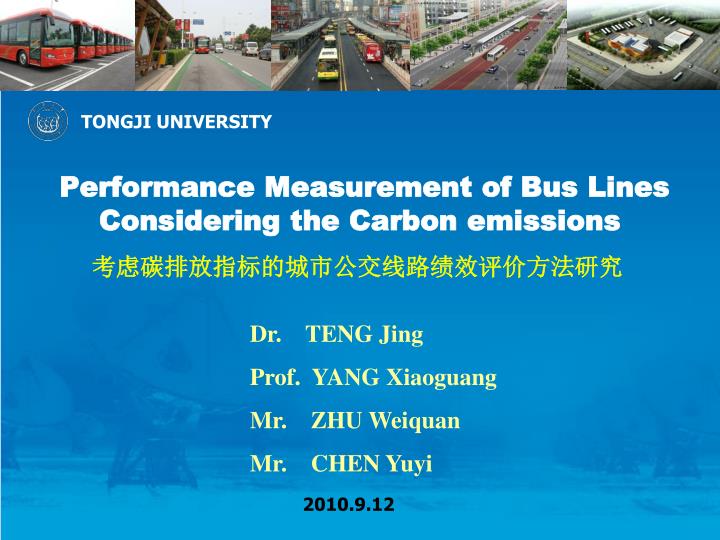
TONGJI UNIVERSITY. Performance Measurement of Bus Lines Considering the Carbon emissions. 考虑碳排放指标的城市公交线路绩效评价方法研究. Dr. TENG Jing Prof. YANG Xiaoguang Mr. ZHU Weiquan Mr. CHEN Yuyi. 2010.9.12. Three elements of performance evaluation on bus lines 公交线路运营绩效评价的三要素.

E N D
TONGJI UNIVERSITY Performance Measurement of Bus Lines Considering the Carbon emissions 考虑碳排放指标的城市公交线路绩效评价方法研究 Dr. TENG Jing Prof. YANG Xiaoguang Mr. ZHU Weiquan Mr. CHEN Yuyi 2010.9.12
Three elements of performance evaluation on bus lines 公交线路运营绩效评价的三要素 Service Quality 服务质量 Operating Costs 运营成本 Carbon emissions 碳排放
The Goal of Low-Carbon Bus Transport System低碳公交的发展目标 • To develop the bus carbon-emission-reduction techniques base on assuring and enhancing the quality of public transport service. 单纯减碳不是目的,需要在公交服务质量保障和提升的前提下,发展公交减碳技术。 • To set up the concept of performance evaluation and estimate the relationship among the Level of Service(LOS), Carbon Emissions and Operation Cost. 引入公交线路绩效评价的概念,综合测度公交线路的服务水平、碳排放以及成本投入的关系。 • To demonstrate the bus lines well operated and spread the experiences according to evaluation results. 树立优良线路示范,推广高绩效线路的运营经验。
The main factors of carbon emissions碳排放主要影响因素 Eg. • Driving mode is determined by the two characteristic parameters which is the engine power and the engine running condition. 行驶模式由表征发动机动力需求的参数和表征发动机运转状态的参数两者确定。 • The influence factors include: real-time speed v, real-time acceleration α, road slope grade, demand of air conditioning Power Ac, the 5s - 25s engine running state before Preaverage-Power and the engine speed index RPMIndex. 影响因素包括:实时速度v、实时加速度α、道路坡度grade 、空调动力需求Ac、发动机之前5s-25s运转状态Preaverage-Power和发动机转速指数RPMIndex。 • The direct impact factor DIF is vehicle dynamic performance and exhaust gas processing performance. 直接影响因素是车辆动力性能和尾气处理性能。 • The indirect impact factors IDIF include: road conditions, bus line condition, passenger volume, traffic condition as well as many other external factors. 间接影响因素包括:道路状况、线路设置、客流量、交通拥挤情况等多种外部因素。
DIF : Vehicles Configuration Conditions直接影响因素:车辆配置条件 Japan EU. China
IDIF1:Road Sections Traffic Conditions间接影响因素1:路段通行条件
IDIF2:Intersections Traffic Conditions间接影响因素2:交叉口通行条件
IDIF3: Bus Stop Configuration Conditions间接影响因素3:停靠站设置条件
IDIF4: Temporary Road Repairs 间接影响因素4:市政工程临时影响条件 Road Maintenance 道路施工
IDIF5:Ridership Demand & Transport Capacity 间接影响因素5:超负荷运输,系统面临整体升级
Input-Output Model of Bus Lines Performance Measurement公交线路绩效评价投入-产出关系模型 Vehicle miles Bus Line Function Service Span Seat miles Labor expenses Transport processes 运输生产过程 Punctuality Rate Fuel expenses Length of Bus Line Number of stops Operating speed Rd. Traffic Saturation Priority lanes Maintenance and depreciation expenses Number of intersections Caron Emissions
Tool: Data Envelopment Analysis(DEA)数据包络分析模型 • DEA evaluate the decision-making units using a mathematical programming model to compare the correlation efficiency of decision-making units. • For the resource and production, the Decision Making Units DMU, referring to the bus lines, has the same inputs and outputs. • According to the comprehensive analysis of the input and output data, the comprehensive and effective indices can be drawn for each DMU number, by which the DMU would be classified and sorted, thus the effective DMU would be determined while the causes and extent of other non-efficient DMU would be provided for the management decision making of the authorities. • 数据包络分析(Data Envelopment Analysis, DEA)是使用数学规划模型比较决策单元之间的相对效率,对决策单元作出评价。长处在于多投入及多产出绩效评估。 • 本研究中决策单元(Decision Making Units)记为公交线路,就其“耗费的资源”和“生产的产品”而言,各DMU 具有相同的输入和输出。 • 通过对输入输出数据的综合分析,DEA 可以得出每个DMU 综合有效的数量指数,据此将各DMU 定级排序,确定有效的(即相对效率最高的)DMU,并指出其他DMU 非有效的原因和程度,给主管部门提供管理决策信息。
Purpose of applying DEA model (1)应用DEA模型的目的 (1) • Cost 成本部分 • Encourage the public transportation agency to strengthen the internal management and control transportation cost. • 激励公交企业加强内部管理、控制运输成本 • Implementscientific and appropriate financial subsidy given by government. • 实施科学、透明的政府财政补贴 • Renews the vehicles and have priority use of environmental vehicles. • 更新车辆、优先使用环保车辆
The purpose of applying DEA model (2)应用DEA模型的目的 (2) • Production 产出部分 • Encourage the public transportation agency to improve the service • 激励公交企业提高服务质量 • Complete more passenger person-kilometers • 完成更多的客运周转量 • Reduce carbon emissions • 减少碳排放
The purpose of applying DEA model (3)应用DEA模型的目的 (3) • Carry out bus priority,improve external conditions • 落实公交优先、改善外部影响条件 • Optimize bus line setting 优化公交线路设计 • Improve road cross-sections 改善道路断面设计条件 • Improve road intersections and signal control setting 改善交叉口设计和信号控制条件 • Improve bus stations 改善公交车站设计条件
Efficiency measurement accounting for undesirable outputs: C-Emissions处理不良产出:碳排放 • When some transit outputs are undesirable (such as vehicle emissions), efficiency measures need to account for the simultaneous production of ‘‘good’’ and undesirable outputs. • The directional distance function takes this into consideration by giving credit to both a higher level of ‘‘good’’ output and a lower level of undesirable outputs. • Shephard distance functions are a special case of the directional technology distance function (Chung et al.,1997) and can be defined as 定向技术距离函数是表示在给定方向下,被观测点对生产前沿面偏离的测度,偏离越小,离生产前沿面越近,该点的生产率水平越高。
Empirical Study应用举例 江苏省江阴市 JiangYin, Jiangsu Province of China
JiangYin Public Transportation Company (JYPTC) operates 707 vehicles and 49 bus routes at present. 江阴公交公司拥有公交车707辆,运营公交线路49条。 All these bus routes are classified into “Inner City”, “Radial” & “Village” services. 这些公交线路分为市区线、放射线、郊区线
The situation before the implementation of bus priority in JiangYin L/100km km/h
The situation before the implementation of bus priority in JiangYin The proportion of bus vehicles accounted in total motor vehicles The proportion of bus vehicle exhaust emissions accounted in total motor vehicle emissions
The situation before the implementation of bus priority in JiangYin Fuel consumption rate of change for one bus vehicle C emmission rate of change for one bus vehicle Running speed rate of change for one bus vehicle
Bus Priority Measures江阴市公交优先举措 • Update purchase 320 CNG buses, occupied 45% of total operating vehicles. 更新购置320辆CNG天然气公交车辆,占总运营车辆45%。 • Construct 149.2km bus lanes, covering 35% of the length of transit route network in central city. 建设“一环八射”公交专用道网络,公交专用车车道长度(双向)149.2Km ,覆盖中心城公交运营里程的35%。 • Construct harbor-shaped bus stops, and carry out plane intersection channeling design. 建设公交港湾停靠站,实施交叉口渠化改造。
Emission Factors of JiangYin Bus Vehicles江阴市公交车排放因子 g/km VOC(Volatile Organic Compounds)有机尾气 PM ( Particle Matter )颗粒物 上表由由IVE模型(International Vehicle Emission Model)模拟计算
The change conditions of the bus lines affected by bus priority measures公交优先措施受益线路的运营情况 The running speed increases significantly. 公交优先措施实施前后——公交车平均行驶车速提高情况 km/h The fuel consumption per vehicle was reduced effectively. 公交优先措施实施前后——公交车辆百公里油耗降低情况 L/100km
The 15 bus lines affected by the bus priority technical and management measures • 100-km fuel consumption was reduced, from the previous 24.1L to 21.8L, fell by an average 9.54%. • The average running speed increases, from 22.0km/h to 29.5km/h, an average increase of 32.7%. • 30% exhaust emissions of bus vehicles was reduced. • Bus punctuality rate reached 92%; punctuality rate of peak hour reached 90%, an increase of 20%. • The attractiveness of bus system was enhanced. Passenger ridership increased by 9%. Passenger satisfaction rate increased, from 64% to 82%. 由于采取公交优先技术和管理措施,受益的15条线路 • 百公里油耗由之前的24.1L,降低到实施后的21.8L,平均下降了9.54%。 • 公交车辆平均行驶速度由之前的22.0km/h,增加到实施后的29.5km/h,平均增加了32.7%。 • 公交车辆的尾气排放量减少30%。 • 公交准点率达到92%;高峰准点率也达到90%,提高了20%。 • 公交吸引力提升,客流增加9%,乘客满意率由64%上升到82%
Correlation between Input-Output Variables using Pearson Correlation Coefficients基于皮尔逊相关系数的输入-输出变量相关性分析
Descriptive Statistics for Input-Output Variables as well as External Environmental Factors输入-输出变量及外部环境因子的描述性统计
Efficiency Scores and Ranking for Bus Routes公交路线效率得分及排名 After considering the influence of the external environmental factors, the ranking of many bus lines changed greatly.
The comparison of pure technical efficiency纯技术效率比较 从中我们可以发现 1.中心城线路绩效水平显著高于中心城区-郊区和郊区线路。 这是由于江阴市郊区线路通行条件优于中心城区,较少收到交通拥挤的影响。中心城区-郊区间点到点直达客流比例大,运输效率高。 • We can found: • 1.The performance of Inner City lines was significantly higher than R&V lines. • The reason is that suburban lines are with better running conditions, and more traffic congestions always happen in downtown. In addition, the main passengers flow distribute with the form point-to-point on the line, which increased the transport efficiency.
The comparison of pure technical efficiency纯技术效率比较 • 从中我们可以发现 • 公交优先措施采取前后,公交系统总体绩效水平有了比较明显提升,中心城线路上升0.27,中心城区-郊区及郊区线路上升0.14。 • 这是由于现阶段采取的公交优先措施主要在中心城区实施,以解决公交通行效率低下的主要矛盾,受益线路多为中心城线路和部分中心城区-郊区线路。因此对中心城区公交线路绩效提升最显著。 We can found: 2.Before and after bus priority measures was taken, the performance of bus system was upgraded obviously, Inner City lines increased by 0.27, R&V lines increased by 0.14. The reason is that at this stage the principal problem of inefficient operation for bus system happened in central city, and the bus priority measures were implemented mainly here. Therefore more Inner City lines were benefited, and their performance was enhanced more significantly.
Follow-up Research后续研究 1、 Introduce bus GPS data to evaluation system, for the quota description of the external factor. 将公交GPS数据引入评价系统,进行外部因素的定量描述。 2、 Introduce more bus service indices, especially the dynamic indices. 纳入更多的公交服务质量指标,特别是动态指标。 3、 Introduce city scale, geography and climate factors to compare the bus lines’ performance of different cities 纳入城市规模、地理和气候因素,以用于不同城市之间公交绩效比较。 4、 Methods of combining the performance measurement and government bus subsidy. 将绩效评价与政府公交补贴联系起来的方法。
Thanks for your listening! tengjing@tongji.edu.cn 09-12, 2010