Download
1 / 11
110 likes | 189 Vues
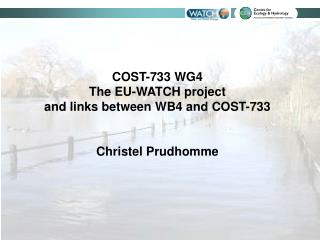
COST-733 WG4 Links between Weather Types and Flood events in Europe Christel Prudhomme. Understanding large scale antecedent conditions. Weather Types/ Classifications from COST A priori, all classifications At present only for Europe: D00 For each large flood events

E N D
COST-733 WG4 Links between Weather Types and Flood events in EuropeChristel Prudhomme
Understanding large scale antecedent conditions • Weather Types/ Classifications from COST • A priori, all classifications • At present only for Europe: D00 • For each large flood events • Frequency of weather type : preceding day(s) • “ : preceding weeks • Frequency anomaly (i.e. is situation exceptional?) • Systematic occurrence of some WT ?
Flood events • Daily flow data series from different data bases • Global Runoff Data Centre (GRDC). Selected 176 • Flow Regimes from International Network Data (FRIEND): 95 • French Banque Hydro (with restriction): 132 [not yet analysed] • UK National River Archive (NRFA): 87 [not yet analysed] • European Water Archive: [not yet retrieved] • Total: 358 [later date : 490 + EWA] • Selected all over Europe • For each catchment select the largest flood peak events • Number of flood peak: 3 * number of years • Criterium of independence between each selected flood peak • POT3 data, with Flood in m3/s, and date
Data analysis • For each river basin • POT3 series: flood magnitude, date • For each day find corresponding Classification/Weather Type ClassA[WTi] • Index 1: Frequency anomaly of weather types PI1 • For each river basin • PI1 = 100*(freq. ClassA[WTi] during flood day - freq. ClassA[WTi] any day )/ freq. ClassA[WTi] any day • If PI1 = -100: ClassA[WTi] never occurred during flood day • If PI1 <0 : ClassA[WTi] occurred less often during flood day than usual • If PI1 >> 100 : ClassA[WTi] occ. more often during flood day than usual • We want to see if, across Europe, some ClassA[Wti] systematically occur more/less often during flood days • Can look at days preceding flood as well
Data Analysis (2) • Index 2: Persistence of weather type PI2 • ‘Is the persistence of k days with ClassA[Wti] linked to a flood’ • Measure the number of times kday with ClassA[WTi] within a window of xday prior to flood events • Calculate conditional probability of kday given there is a flood event: PI2 • Compare PI2 with value expected purely by chance, knowing the probability of occurence of ClassA[WTi] [Binomial/Bernouilli] • If PI2 greater than expected by chance, the persistence of ClassA[WTi] at least kday within xday followed by flood event is statistically significant • Calculate PI2 and Bernouilli for windows up to 5 days, k day varying from 0 to 5
Results presentation • Maps: for each ClassA[WTi] , one dot per catchment • PI1 – Positive : back / negative : grey – Size dot: PI1 magnitude • PI2 – Significant: black / non significant : grey – Size dot: PI2 magnitude • Done for the day of the flood, and up to 5 days before • One index per season • Huge number of maps (for CEC: 200 * 5 PI1; 200*5*5 PI2) • Histographs:for each ClassA[WTi] • Proportion of catchments in PI1/PI2 categories • Aim: to identify ClassA[WTi] with largest number of catchment with high PI1 / PI2 • Future: plot diagrams, for each category, with evolution with Lag time; all WT together
Further work… • Analysis for all catchments • First need to get data from other databases • Work on ‘summary’ graphics • Focus on • Lag: any evolution on windows of analysis • Meaning of PI2 compared to PI1. Which one is best • Threshold to assess significance of link between ClassA[WTi] and flood events • Regional analysis: catchments in different regions might be linked to different weather type • Importance of seasonal analysis • Identification of ‘regional flood’ days, depending on the proportion of catchment in study area has a POT3 event that day • Continue lit review to have more ideas for analysis!