Download
1 / 45
470 likes | 621 Vues
Equitable Economic Development: Examples From The Field. September 23 rd 2006 Presentation for the National Resource Center for the Healing of Racism Calhoun County Summit On The Healing of Racism Denis Rhoden Jr. Associate Kirwan Institute for the Study of Race and Ethnicity

E N D
Equitable Economic Development: Examples From The Field September 23rd 2006 Presentation for the National Resource Center for the Healing of Racism Calhoun County Summit On The Healing of Racism Denis Rhoden Jr. Associate Kirwan Institute for the Study of Race and Ethnicity The Ohio State University http://www.kirwaninstitute.org/ rhoden.8@osu.edu
Today’s Presentation • A Dynamic, Global Economic Landscape • Equity and the Economic Development Process • Equitable Economic Development Initiatives Across the Country • The Regional Significance of the Inner City • Calhoun County Collaborative Advantage • Pulling It all Together
The American Worker Paradox • American workers now produce over 30% more each hour they work than ten years ago, yet the wages of the typical American worker—the one at the very middle of the income distribution—have risen less than 1% since 2000. • The typical worker earns only 10% more in real terms (adjusted for inflation) than 25 years ago, even though overall productivity has risen much faster. Source: Economist “Inequality in America: The rich, the poor and the growing gap between them.” June 15th 2006.
Our Charge • Domestically the response to the global interdependent economy has been episodic and reactive; reflecting a failure to accept the changing competitive landscape. • Federal Reserve Chair, Ben Bernanke, recently urged local political leaders to seriously acknowledge the “costs of globalization,” and “help their constituents come to terms with them.” Source: Andrews L Edmund “Fed Chief Sees Faster Pace for Globalization” New York Times August 25, 2006
Reducing Volatility; Inclusion & Integration • We are challenged at every level, to be more inclusive and integrated • Bernanke’s comments encourage policymakers to pursue strategies that meet two conditions: • 1. “The benefits of global economic integration are sufficiently widely shared,” and • 2. “Displaced workers get the necessary training to take advantage of new opportunities.” Source: Andrews L Edmund “Fed Chief Sees Faster Pace for Globalization” New York Times August 25, 2006.
A Unified Response • Action is being taken in regions throughout the country to implement policy that promotes collaboration to generate productive needed to adapt to changing conditions and global economic hierarchies • Broadly, we need to define what the future should look like with our collective imagination • A New Paradigm! : Targeted Universalism • What is our alternative vision? • A model where we all grow together • A model where we embrace collective solutions • This vision requires collective action and will require coalitions to be successful
Historically Today De Jure Neutral Structures Biased Structures What is occurring here to replicate the outcomes today? Biology Disparate Outcomes Disparate Outcomes Individuals/ Culture Structures/ Opportunity A Framework For Disparity
Policy Mismatch? Economic Development Is Not Simply Incentives–It is Public Policy Aimed at Crafting Place Level Advantage. Who Chooses What to Invest in? ECONOMIC DEVELOPMENT POLICY REGULATION / LEGISLATION CONDITIONS PROGRAMS / PROCESSES
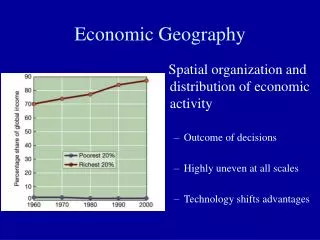
The Web of Opportunity • Opportunities in our society are geographically dispersed or clustered • This distribution is the basis for our understanding of a “good” or “bad” neighborhood - - “high” and “low” opportunity communities • Your location within this “web of opportunity” plays a definitive role in life potential and outcomes • Individual characteristics still matter but the environment plays a systematic role • Often impacting individual decision making
Fiscal Policies Health Childcare Employment Housing Effective Participation Education Transportation Opportunity Is Dynamic & Layered
Capturing Equitable Economic Development • Equitable economic development is a policy strategy focused on correcting policy mismatch from the perspective of distribution and access to opportunity. • In particular establish regional the economic and equity case for areas (e.g. neighborhoods, cities, counties) and groups (e.g. African American, rural) disconnected from opportunity.
Why Equitable Economic Development? • Equitable outcomes in economic development are equally concerned with the ability to access and the presence of opportunities • Households, businesses and individuals are being challenged to create local opportunities within a structure that does not that purposefully impacts the fluidity of assets and capital. • Practices such as poaching in economic development are the unintended consequence of mismatches in a web of policy impacting the fitness and productivity of assets.
Our Response • Geographic differences in the ability to put assets to work because capital does not impact the same assets the same way across space. Largely episodic and fragmented • Easier access to credit • Tax Incentives • Many More • Where is the systematic broader policy change to revive unproductive assets and inspire enterprise and innovation?
Policy Mismatches Prevail To Date • Regions that are the most fragmented are more economically depressed. Why? • No unified strategy for economic development (infighting over jobs and new businesses) • A less qualified and educated work force due to educational disparities in the region • Entry level and low skill work force spatially isolated from suburban job opportunities • More likely to exhibit sprawling growth that wastes public resources on new roads, sewers, schools in undeveloped areas, while existing resources are left to deteriorate
Noted Concerns of Existing Paradigm • Hyper Competitive Policy Structure: • ‘Zero-sum game’: A gain is offset by another group’s loss • Jobs traveling across taxable boundaries • Inefficient use of subsidy to meet concerns within a typically short political life-span • Very few incentive programs allow for broader wealth redistribution to reduce inequity
Narrow Focus Masks Opportunities • Static Policy Mechanisms and Underutilized Integrated Solutions • Policy reflects perspective. Many policies are narrowly defined (e.g. Eco. Dev’s Attraction, Retention, Expansion). Few policy integrations to address the factors impacting opportunity. • The result is competency and competitive disparities between residents captured by neighborhood boundaries. • Economic development professionals have limited tools to provide comprehensive incentives • At worse forced to compete across jurisdictions (suburban, urban), at minimum inefficient or under leveraged use of public investment dollars.
Poor Spatial and Racial Distribution Weakens Collaborative Advantage • Not seriously addressing the geographic (and racial) outcomes • The most isolated geographies–inner city, rural and first-ring suburbs face similar decline yet few policy solutions exist to reduce problems from common sources, (e.g. land use management, infrastructure investment, education). • Joblessness, poor education are among the factors resulting in economic and social isolation limit meaningful interactions and sustain negative stereotypes across groups and places.
Regional Economic Health • Sprawl and fragmentation harm all residents of a region: inner-city, suburbs & exurbs • Equity-based regionalism can positively impact a region’s economic health • Research suggests regions who utilize regional policies are economically (and socially) healthier • Outside of the West, there is only modest local action in developing incentive-based affordable housing programs. Nearly two-thirds of the municipalities have incentive programs and half have dedicated funds established. No other region comes close to these figures Source: Pendall et al (2006). Traditional to Reformed: A Review of the Land Use Regulations in the Nation’s 50 largest Metropolitan Areas. Brookings Institution
Equitable Economic Development In Practice Industry-focused workforce development Stakeholders and Policymakers focused on these areas… MBE/SBD development Equitable Economic Development Practice Areas Leveraging and distributing resources & investments Neighborhood development
Equitable and Productive Policy • Concern about fairness, • BURA Predatory Loan Program • encouraging productivity in the core, and • Land Value Taxation (Pittsburgh and Harrisburg) • Integration for equitable opportunity distribution • Multiple partners and policy infrastructure connections integrating economic and workforce development policy (i.e. WIRED)
Equitable Economic Development is Multi-Faceted and Interdependent • Tax Based Sharing Plans (Twin Cities) • Fair Share Housing Laws (Montgomery County) • Metropolitan-Wide School Districting (Charlotte-Mecklenburg) • Anti-Sprawl Initiatives (Portland) • Regional Public Transportation (Indiana Interfaith Group)
Staking Claim: East Baltimore • Scale varies; but the interventions are leading to more equitable results. • In Baltimore, neighborhood economic development resulted in an 80-acre, $800 million neighborhood redevelopment over an 8-10 year period • 1,200 Housing Units (new and rehabilitated, homeownership and rental) • new retail facilities; a set of supportive services • and community building activities • up to 6,000 new jobs will be created for skill levels ranging from high school to those with advanced college degrees
Local Interventions • Layers of Policy Infrastructure • City Ordinance • Economic Inclusion Plan • Cross-Sector Partners • Anne E. Casey • Johns Hopkins Hospital (located in neighborhood) • Private Developers • Planners • Community Development Corporation • Implementation • Local compliance & administration (East Baltimore Development Inc.)
Level of Greater Impact • Regional interventions aimed at increased productivity, equity-aware • In the Northwest North Carolina corridor (includes Greensboro and Winston Salem, NC regions). • Conducted CEDS funded by Dept. of Labor • Brought together region’s eight counties to create a unified economic development strategy • Reconnected former manufacturing employees into the ‘design’ industry through educational interventions increasing worker preparedness for employment in the field
Regional Interventions • CEDS planning process occurred county to county, local leaders in each county leveraged resident awareness to pursue good ideas while they were fresh • Among the themes which emerged was to take aggressive steps to reduce social disparity. Their research revealed, as disparity decreases, the potential to attract new investment increased • Receiving additional federal funding from DOL to pursue policies aimed at linking workforce investment and economic development
Business Accelerator • The Cincinnati region is about 43 percent African American, yet African American enterprises account for only two percent of the aggregate revenue • The Minority Business Accelerator approach is to deliver more sizable and scalable MBE’s to the market place (supply-side) as well as create a more aggressive and robust corporate MBE procurement environment (demand-side).
MBA Outcomes • Minority Business Accelerator provides an example of a privately-led, regionally and racially aware economic development intervention. • MBA does maintain connections with academic institutions; in particular the University of Cincinnati and University of North Kentucky • The Cincinnati MBA generated $200 million dollars in commitments from 15 companies regionally located or headquartered in Cincinnati • Responsibility of tracking and reporting remain a high priority to the MBA and its corporate partners. Reporting is completed through a confidential process, verified directly by partner CEOs
Community Benefit Agreements • Emerging economic inclusion tools for property development by real estate developers and coalitions of community organizations • CBAs have been effective against limiting potential negative externalities which can further destabilize neighborhoods
CBA Create Value & Capacity • Past CBAs have been successful in negotiating the following investments in residents and neighborhoods • a living wage requirement for workers employed in the development; • a “first source” hiring system, to target job opportunities in the development to residents of low income neighborhoods; • space for a neighborhood-serving childcare center; environmentally-beneficial changes in major airport operations; • construction of parks and recreational facilities; • community input in selection of tenants of the development; and • construction of affordable housing • CBAs are a market based, community oriented development tool: they do not require a legislative process and provides the basis to develop legislation that supports broad applications based on performance
Stakeholders in Action • To recap, Equitable Economic Development interventions utilize policies that address inequity in a variety of ways. • Private Equity • Land Use • Worker Preparedness • Institutional Grants • Infrastructure • Advocacy • Compliance • Business Accelerators
Place and Life Outcomes • Equitable Economic Development is broad, integrated and its interventions intend to enhance and distribute prosperity and reduce barriers to capital for households and businesses… • Housing location determines the quality of schools children attend, the quality of public services, access to employment and transportation, health risks, access to health care and public safety • Greater access to risk capital (dynamic policy infrastructure and an active network of deal and policy makers) to reduce friction-barriers and increase productivity.
America’s Inner City in Context • Between 1990-2000 grew to 21M residents from 17M (or 24%) • Poverty in the inner city declined to 31% from 35% during the same period. • Much of the reduction can be attributed to the movement of poverty outside of the inner city. • Inner city economies in the 100 largest cities are a substantial portion of the U.S. economy • 8% of U.S. private employment (9 million); • 814,000 establishments Source: ICIC “SOICE Teleconvening Presentation” February, 2005
Regional Productivity & the Inner City • While some inner cities are doing well in terms of employment growth, 90 out of 100 are under-performing their MSAs. With a wide range of performance, on average inner cities generated 1% annual job growth (vs. 3.4% for the MSA – exclusive of IC.) • Inner city/MSA income gap is 50% ($25K vs. $52K), wage gap is 0% (both at $38K). • 77% of jobs in IC are not held by IC residents (42% are suburban ’commuters’ and 35% are from the rest of the city). Source: ICIC “SOICE Teleconvening Presentation” February, 2005 Notes: Figures above are for the nation’s 100 largest inner cities
Jobs & the Inner City • Inner cities gained jobs in the 1990s but lagged behind the rest of the U.S.: • Job growth in inner cities grew at an average annual growth rate of 0.8% from 1995-2001, but this lagged behind the rest of the city and MSA (2.1% and 3.7% respectively); Sixty-one inner cities gained jobs between 1995-2001. Of these 21 grew faster than the rest of their cities. Six grew faster than the rest of their metropolitan areas, including Tulsa, San Jose, Boston, Winston-Salem, Charlotte, Augusta • The average salary of jobs located in the inner city is $38,500, compared to $41,000 in the rest of the city and $35,000 in the rest of the metropolitan area. But inner city residents do not hold the higher paying jobs—inner city residents are only half as likely to hold professional positions as rest of city and rest of metropolitan area residents: 22% of inner city residents are professionals, vs. 41% of rest of central city residents, and 37% of rest of metropolitan area residents; • In 2001, at the onset of the economic downturn, inner cities experienced a 0.2% decline in business employment. Employment in the rest of city and the rest of metropolitan area continued to grow at 2.4% and 0.3% respectively. Source: ICIC, “State of Inner City Economies, 2004
Inner City Competitiveness Drivers • Source: Initiative for a Competitive Inner City
Collaborative Advantage in Calhoun County • Concerned with the creation of meaningful synergies between organizations resulting in networking, coordination, cooperation, and collaboration. • Collaboration is “information exchange, altering activities, sharing resources, and enhancing the capacity of another for mutual benefit and to achieve a common purpose.” • What Calhoun County institutional assets can be leveraged to create collaborative advantage? • What would you organize around to effectively use the newfound synergies? Source: Diebold et al. (2000) “Building an Intervention: A Theoretical and Practical Infrastructure for Planning, Implementing, and Evaluating a Metropolitan-Wide School-To-Career Initiative” Journal Of Educational and Psychological Consultation Vol. 11 Issue 1 pp 159
Metropolitan Economy • Between 2000 and 2003, the Battle Creek-Kalamazoo, MI metropolitan area lost nearly 8700 jobs (an average of nearly 2900 per year). • 15% of the African American population (nearly 6,000 people) left the region from 2002 to 2004. Source: U.S. Census Bureau, American Community Survey
Poverty: A Multi-racial challenge • Calhoun County poverty suffers the same challenges found around the U.S. (15,000 in poverty or 11% of the total population) • African Americans are over represented; 2x more likely to be in poverty than Whites (23% versus 9%) • However, there are substantially more Whites in poverty than any other group (10,000 Whites compared to 3,000 Blacks)
Calhoun Collaborative Advantage • Agency policy integration of Workforce and Economic Development (State to Local) • State of Michigan Office of Labor and Economic Growth • Barry / Branch / Calhoun County Workforce Development Board • Calhoun County Economic Development Council • Calhoun County Area Technical Center • WIA Youth Program • Calhoun County Intermediate School District • Career Preparation • Michigan Works! Workforce Development Team • Innovating Private Partners (Pharmacia & Upjohn Company, Eaton Corporation, Stryker Corporation, Dana Corporation, Kellogg Company) • Identify economic intersections to create policy goals and tools from the Calhoun perspective.
Reviving Dead Capital • Informal sources of risk capital are critical for entrepreneurial and start-ups. • What is informal risk capital? • In 2003, a major source of risk capital, household wealth represented over $325 Billion dollars to households (about $9,084 for every owner-occupied home in the nation) • By directly addressing how land use creates wealth for some opportunities can be created for all. Source: Parisi, Michael and Hollenbeck, Scott. (2005) “Individual Income Tax Returns, 2003” Statistics of Income Bulletin. Fall 2005 Vol. 25 Issue 2
Capital Formation is a Housing Issue • Calhoun County account for 1/6 of 1 percent of the federal mortgage credits (approx) $491M in 2003 • Nearly eighty percent of the owner-occupied units are White, with potential to access approximately $322M. • In contrast, Black householders had about $27M in potential funds that could be invested in enterprise (12 times less than Whites) • Exactly the difference in homeownership between Blacks and Whites in Calhoun County. • Although the credit is not ‘cash,’ much like home value represents capital that can be put to work. Source: DataPlace, U.S. Census Bureau, Parisi, Michael and Hollenbeck, Scott. (2005) “Individual Income Tax Returns, 2003” Statistics of Income Bulletin. Fall 2005 Vol. 25 Issue 2
Regional Assets, Equity Focus • Isolation comes in many forms. Urban Calhoun is not being infused with private capital and investment at the same rate as peripheral communities. • Evidence suggests however, the strongest regions look to the core as a source of jobs, capital and innovation. The lack of urban investment has a powerful and negative effect on the vitality of the entire region. • Private capital ability to reach under productive assets is imperative to creating strong regions and efficient markets • Examples: Affordable owner-occupied housing, expansion of CEDC role, EBDI (integration among public and private intermediaries)
The Need to Think in Terms of Opportunity • A disparity model is a less-than-sufficient framework for stimulating collaborative advantage and broader solutions to lift all groups out of weak economic conditions • In the global market, it is less relevant for us as a nation to view the White experience as THE benchmark of prosperity, because we are all losing ground. • “Opportunity structures” are the resources and services that contribute to stability and advancement • Fair access to opportunity structures is limited by segregation, concentration of poverty, fragmentation, and sprawl in our regions – for low-income households and families of color • Because opportunity structures exist as a “web” a multi-faceted, equity-grounded approach is needed
Linked Fate • Why should those living in inner-ring, outer-ring suburbs, and exurbs care about inner-city disparities? • A region and all its residents share a linked fate • This issue is particularly important today • To thrive, regions must be competitive in the global economy • Regions cannot compete with wasteful and redundant services, and fragmented governments
Questions or Comments? For More Information Visit Us On-Line:www.KirwanInstitute.org