Download
1 / 41
410 likes | 489 Vues
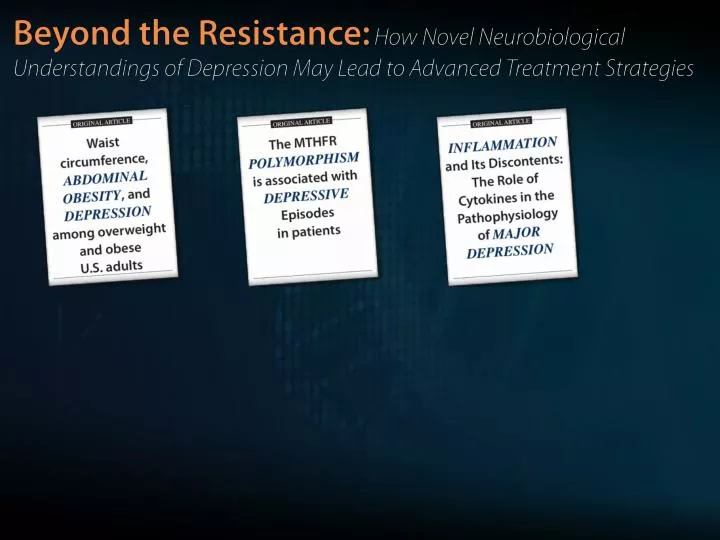
The Need for Long-term Treatment Options in Depression.

E N D
The Need for Long-term Treatment Options in Depression 1. World Health Organization Web Site. Accessed July 7, 2005. 2. Greden JF. J Clin Psychiatry. 2001;62(suppl22):5-9. 3. Fawcett J. IntClinPsychopharmacol. 1993;8:217-220. 4. Rowan PJ, et al. Psychol Med. 2002;32:903-908. 5. Druss BG, et al. Am J Psychiatry. 2000;157:1274-1278. 6. Simon GE. Biol Psychiatry. 2003;54:208-215. • Fourth most disabling condition worldwide1; most disabling condition for females (US) • Increased morbidity of comorbid general medical conditions2 and increased rate of suicide as percent of total mortality3 • Loss of productivity in workplace2 • Patients with depression use substantially more healthcare services than do patients without depression4-6 • Depression is life shortening • Increased risk of CV events, stroke, etc.
Why is Treatment of Depression so Important? Annual mortality risk (%) by age groups and diagnoses of mental illness, compared to England and Wales population in 2008. UK Pop. MDD Life expectancy was reduced by 10.6 years for males and 7.2 years in females with MDD compared with UK population. Chang CK, et al. PLoS One. 2011;6:e19590.
Chapter 1:Lack of Appropriate Treatment Response: Impact, and Neurobiology
STAR-D Remission Rates Are Generally Low Across All4Levels Level 1 1 11.9 weeks Level 3 4,5 ≤14 weeks Level 2 2,3 8-10 weeks Level 4 6 ≤14 weeks Remission Definition: HAMD-17 ≤7 % Remission Low Treatment Resistance High Mono, single medication regimen; Augm, combination medication treatment. 1Trivedi MH et al. Am J Psychiatry. 2006;163(1):28-40; 2Trivedi MH et al. N Engl J Med. 2006;354(12):1243-1252; 3Rush AJ et al. N Engl J Med. 2006;354(12):1231-1242; 4Nierenberg AA et al. Am J Psychiatry. 2006;163(9):1519-1530; 5Fava M et al. Am J Psychiatry.2006;163(7):1161-1172;6McGrath PJ et al.Am J Psychiatry.2006;163(9):1531-1541.
STAR-D Reveals Its Secrets – The Dangers of Residual Symptoms & Lack of Remission 1.00 Overall 40% relapse rate • Sleep disturbance • Sad mood • Appetite/weight • Concentration • Outlook • Suicidal ideation • Involvement • Energy/fatigue • Psychomotor 0.75 0.50 0 domains 1 domain 2 domains 3 domains 4 domains 5 domains Cumulative Probability of Relapse 0.25 0.00 0 10 20 30 40 50 60 QIDS-IVR Relapse Time (Weeks) Increasing number of symptom domains leads to increased risk of relapse (x2[5]=17.7155, P=0.0033) Nierenberg AA et al. Psychol Med. 2010;40(1):41–50
Potential Causes of Poor Response to Antidepressant Treatment • Misdiagnosis • Inadequate treatment, under-treatment, or starting treatment too late1 • Failure to achieve initial remission2 • Non-adherence • Failure to address concurrent disorders1 • Occult substance abuse • Occult general medical conditions (GMCs) • Concurrent Axis I or II disorders 1. Thase ME, Rush JA. J Clin Psychiatry. 1997;58(suppl 13):23-29. 2. Judd LL, et al. J Affect Disord.1998;50:97-108.
Delay of Treatment May Influence the Future Course of MDD DUI >12 Months (n=23) DUI ≤12 Months (n=45) 2.5 *p=0.027 2.0 1.5 Number of Events Occurring During the 4-year Follow-up Period 2.17* 1.0 1.24 0.5 0.65 0.39 0.31 0.20 0 Recurrences Hospitalizations Suicide Attempts DUI=Duration of untreated illness, interval between the onset of the first episode and the first antidepressant treatment; MDD=Major depressive disorder. Altamura et al. Int J Clin Pract 2007;61(10):1697-700.
Is antidepressant resistance a precursor to Bipolar Disorder? Rates of diagnosis change from MDD to bipolar disorder 30 – DTT 2000 2001 2002 2003 2004 2005 2006 2007 25 – 20 – Participants with medication-resistant history (difficult-to-treat group (DTT)) without any antidepressant use (easy-to-treat group 1 (ETT-1)) or those without any change in antidepressant (easy-to-treat group 2 (ETT-2)). Participants who changed antidepressant just once, after an adequate antidepressant trial (intermediate level of difficulty to treat (ITT)). 15 – ITT 10 – ETT-1 ETT-2 5– 0– Li et al, 2011, Br J Psychiatry, in press
Patients With MDD Who Did Not Respond to Antidepressants Had Higher Inflammatory Cytokine Levels TNF- IL-6 p=0.01 p=0.004 IL-6(pg/ml) TNF-(pg/ml) Controls Depressed Euthymic Controls Depressed Euthymic 24 healthy controls and 28 patients with depression (HAMD17 >20) after 6 weeks of SSRI treatment and 16 euthymic patients (previously resistant to SSRIs) currently successfully treated with an SNRI or an addition of lithium to SSRI treatment. HAM-D=Hamilton depression score; MDD=Major depressive disorder; SNRI=Serotonin–norepinephrine reuptake inhibitor; SSRI=Selective serotonin reuptake inhibitor; TNF=Tumor necrosis factor.O’Brien SM, et al. J Psychiatr Res. 2007;41:326–331.
Frodl TS et al. Arch Gen Psychiatry 2008;65(10):1156-1165. Remission May Protect the Brain From Long-Term Depression-Related Changes In this prospective, longitudinal study, 38 participants with MDD and 30 controls were followed for 3 years. At the start and end of this period all participants had brain morphometry assessed by MRI. Patients with MDD who went into remission showed significantly less volume reduction in brain areas of direct relevance to the path-ophysiology of MDD when compared to patients with MDD who did not achieve remission.
Chapter 2:Inflammation and Depression: Cause, Consequence or Collaborator ?
Stress and inflammation in MDD IL-1, TNF-, IL-6 Psychosocial stress, social isolation, personality factors A IL-6 IL-10, TGF- Major depression sickness behavior Euthymia Stress resilience G HPA - axis k t Immunoregulation i - c IL-10, TGF- /-AR IL-1, NE TNF-, IL-6 NF-B 7nAChr GR ACh TLR Infection, tissue trauma, neoplasm GCs Macrophage Raison et al, Arch Gen Psychiatry. 2010;67(12):1211-1224
Inflammatory Markers Predict the Future Development of Depression Tertile 1 (low) 100 – Tertile 2 (medium) Tertile 3 (high) 98 – Percent 96 – 94 – 92 – 90 – 0 346810 Time, years In a cohort of 644 initially non-depressed females, 48 developed de novo MDD over an approximate 10 year follow up. Survival plot (Kaplan-Meier) showing the probability of remaining free of de novo major depressive disorder for women stratified into tertiles of hsCRP. The concentration of hsCRP in each tertile is: low, <1.12 mg/l; mid, 1.12-2.97 mg/l; and high, >2.97 mg.l. Pasco et al. Brit J Psychiatry 2010, 197:372-377.
Inflammatory Cytokine Levels May Be Associated With Symptom Severity in MDD Patients Comparison of 9 MDD patients with 9 matched healthy controls *Correlations of IL-6 level with guilt, self-esteem, and suicidal thoughts remained significant after Bonferroni correction IL-6=Interleukin-6; MDD=Major depressive disorder; VAS=Visual analogue scale. Alesci et al. J Clin Endocrinol Metab 2005;90(5):2522-30.
Elevation of Inflammatory Cytokines in CSF May Alter 5-HT and DA Metabolism Inflammatory cytokines and monoamine metabolites were compared in 63 suicide attempters and 47 healthy controls. MADRS scores correlated significantly with CSF IL-6 levels. IL-6 and TNF-alpha correlated with CSF 5-HIAA (5-hydroxyindoleacetic acid) and HVA (homovanillic acid).Higher cytokine levels were associated with increased suicidality. Lindqvist D, et al. Biol Psychiatry. 2009;66:287-292.
Glia–Neuron Interaction May Influence Neurotrophic Factors Miller et al. Biol Psychiatry 2009;65(9):732-41.
Relationship between Depression & Inflammatory Cytokines and Neurotrophic Factors Negative correlation between depression and brain-derived neurotrophic factor Positive correlation between depression and IL-6 Yoshimura R, et al. ProgNeuropsychopharmacolBiol Psychiatry. 2009;33(4):722–726.
Relationship Between Obesity, Metabolic Syndrome and Depression Associationbetweenthemetabolicsyndrome(MetS)anddepressionineachbodymassindex(BMI)category.Graphdisplaystheoddsratio (OR)fordepressionafteradjustmentforage,gender,priorcardiovascular disease,employmentstatus,maritalstatus,smokingstatus,dietaryscore, andphysicalactivity.ObesitywasdefinedasaBMI 30andoverweight statusasaBMIbetween25and30kg/m2 Odds Ratio - Depression Skilton et al, 2007, Biol Psychiatry, 62(11): 1251-7.
Adiposity, Inflammation and Depression High caloric intake in the diet leads to increased accumulations of lipids in adipocytes. Increased lipid content results in an increased release of MCP-1 (CCL2), a chemoattractant that increases the infiltration of macrophages into adipose tissue. Both adipocytes and macrophages release inflammatory mediators such as IL-6 and TNFa into the peripheral circulation. Shelton and Miller, Progress in Neurobiology 91 (2010) 275–299
MDD, Adiposity and Inflammatory Markers 50 MDD patients compared with 50 healthy matched controls Miller GE et al. Am J of Cardiol. 2002;90(12):1279-83
BMI ≤25 25< BMI ≤30 BMI >30 Body Mass Index Impacts Antidepressant Response Response to antidepressant treatment according to weight status. Mean Hamilton Depression test (HAM-D) rating scores and SEMs for 5 weeks after hospitalization (left) in normal-body mass index (BMI) and high-BMI patients and (right) in normal-BMI, overweight, and obese patients 31 HAM-D score 29 29 BMI ≤25 BMI >25 27 27 25 25 23 23 21 21 19 19 17 17 15 15 13 13 admission week 1 week 2 week 3 week 4 week 5 admission week 1 week 2 week 3 week 4 week 5 Kloiber et al. Biol Psychiatry. 2007, 62(4): 321-6
Chapter 4:Fascinating Folate: Genetic Regulation of FolateMetabolism Two Sides of the Coin : L-methylfolate and Homocysteine The Role of L-methylfolatein Tri-Monoamine Synthesis
Folate Essentials: • Folate is a B-vitamin that cannot be synthesized de novo by the body; it must be derived from diet or augmentation • Dietary folate found in leafy green vegetables, legumes, beans, liver, citrus fruits and yeast • Folic acid is a synthetic molecule more highly absorbed (85-95%) than is dietary folate (dihydrofolate) • Multiple biochemical conversions required for dietary folate (or folic acid) to become metabolically active Miller, A.L. Alt Med Rev 2008;13:216-26
Synthetic Folic Acid Folate Metabolism DHF Reductase MTHFD1 Dihydrofolate Tetrahydrofolate 10-formyl-THF 5,10 Methyenyl THF 5,10 Methylene THF MTHFR 5-MTHF BBB 5-MTHF Williams FF et al. Pharmacokinetic Study on the Utilization of 5-methyltetrahydrofolate and Folic Acid in Patients with Coronary Artery Disease. Br J Pharmacol. 2004;141(5):825-30.
The Folate Cycle From 10,000 Feet Folic Acid DHFR Dihydrofolate DHFR De novo Purine Synthesis MTHFD1 Tetrahydrofolate serine 10-formyl-THF Thymidylate Synthesis & DNA Repair cSHMT 5,10-methyenyl-THF MTHFD1 serine dTMP MTHFD1 dUMP 5,10-methylene-THF DHF MTHFR C677T THF? Tryptophan Tyrosine L-methylfolate BH4 MTHFR A1298C MTR Methionine Homocysteine Cycle MTRR DHPR Methionine Homocysteine MAT COMT Promotor CBS? BH2 SAMe Cystathionine SAH Dopamine Norepinephrine DNA Serotonin DNMT Ammonia Cysteine MAO A MAO B COMT MAO B COMT Methylated DNA, RNA, protein, lipids Glutathione HIAA HVA HVA VMA VMA Morris DW et al. J Altern Complement Med. 2008;14(3):277-285; Miller AL. Alt Med Rev. 2008;13(3):216-226; Stahl SM. J Clin Psychiatry. 2008;69(9):1352-1353; Farah A. CNS Spectr. 2009;14(1 Suppl 2):2-7.
Homocysteine and NMDA Toxicity SAH HOMOCYSTEINE HCS04 HMS03 Glutamatergic NMDA agonism Reduced kyn acid Reduced trophic support Excitotoxic Cell death Reduced NMDA antagonism cardiovascular, metabolic and psychiatric disturbance Haroon et al. Neuropsychopharmacol2011; Epub; Oxenkrug. J Neural Trans 2011; Epub; B ottiglieri. ProgNeuropsychopharmacolBiol Psychiatry 2005; 29: 1103-12
Interface of inflammation and neurotransmitter synthesis in MDD Tetrahydrobiopterin (BH4) is a critical cofactor for the rate-limiting enzymes involved in the synthesis of the monoamine neurotransmitters, including (1) the synthesis of tyrosine (tyr) from phenylalanine (phe) by PAH; (2) the synthesis of L-3,4-dihydroxyphenylalanine (L-DOPA) from tyrosine (tyr) by tyrosine hydroxylase (TH) leading to the production of dopamine and norepinephrine; and (3) the synthesis of 5-hydoxy-L-tryptophan (5-HTP) from tryptophan (tryp). BH4 is degraded to BH2, which can be regenerated to BH4 through pathways supported by folic acid, L-methylfolate, and SAMe. BH4 is relatively unstable and in the context of inflammation and oxidative stress can undergo non-enzymatic oxidation leading to the irreversible degradation of BH4 to XPH2. Haroon et al,2011,Neuropsychopharmacology, in press
L-Methylfolate is a Required Cofactor for Monoamine Synthesis1 Serotonin Tryptophan Tryptophan hydroxylase BLOOD CNS Melatonin MTHFR BH4 L-methylfolate Dopamine Tyrosine Tyrosine hydoxylase Norepinephrine Robust levels of CNS L-methylfolate may be necessary to maximize monoamine synthesis.2 Adapted from: Bottiglieri T. Progress in Neuro-Psychopharmacology & Biological Psychiatry. 2005;29:1103-12. Stahl SM. L-Methylfolate: A Vitamin for Your Monoamines. J Clin Psychiatry. 2008. 69;9:1352-53. 3. Borjigin J. et al, CircaCircadianregulation of pineal gland rhythmicity. Mol Cell Endocrinol, 2011, in press
Up to 70% of MDD Patients Have a Genetic Mutation Reducing Ability to Convert Folic Acid to L-methylfolate T/T Polymorphism 14% C/C Polymorphism 30% C/C C/T T/T C/T Polymorphism 56% • Patients with the C677T MTHFR polymorphism have low CNS L-methylfolate.1 • Low CNS L-methylfolate is associated with low production of serotonin, norepinephrine and dopamine.2,3 Kelly CB et al. J Psychopharmacol. 2004;18(4):567-71. Bottiglieri T et al. J NeurolNeurosurg Psychiatry. 2000;69:228-32. Surtees R, Heales S, & Bowron. Clinical Science. 1994;86:697-702.
Risk Factors for Low CNS L-methylfolate 1. Bottiglieri T. Progress in Neuro-Psychopharmacology & Biological Psychiatry. 2005;29:1103-12.; 2. Stahl SM.J Clin Psychiatry. 2008;69(9):1352-53.; 3. Kelly B J et al. Psychopharmacol. 2004;18(4):567-71.; 4. Amilburu A et al. Inhibition of intestinal absorption of 5-methyltetrahydrofolate by fluoxetine. J PhysiolBiochem. 2201;57(2):71-80; 5. Sobczyriska-Malefora A et al. Erythrocyte folate and 5-methyltetrahydrofolate levels decline during 6 months of oral anticoagulation with warfarin. Blood CoagulFibrinolysis. 2009; Jun;20(4):297-302.; 6. Kelly CB et al. J Psychopharmacol. 2004;18(4):567-71; 7. Bottiglieri T et al. J NeurolNeurosurg Psychiatry. 2000;69:228-32.; 8. Surtees R, Heales S, & Bowron. Clinical Science. 1994;86:697-702.
Chapter 5:Folate: Clinical Studies and Their Usefulnesin Clinical Practice
Study Inclusion Criteria Study Subjects • Adults meeting DSM-IV criteria for MDD, current • QIDS-SR ≥12 at screen and baseline visit • Has not failed more than 2 antidepressant trials of adequate dose and adequate duration in current MDE (adequate duration = at least 8 weeks) • Treated with SSRI during current episode for ≥8 weeks with stable SSRI dose in therapeutic range X 4 weeks • 75 depressed patients with inadequate response to SSRIs were enrolled in a 60-day trial which was divided into two, 30-day periods (Phases 1 and 2).
Efficacy Analysis SPCD Trial Design Randomize 1 3 4 SSRI + L-methylfolate 15mg SSRI + Placebo SSRI + Placebo Phase 1 30 days Non Responders Non Responders X 2 5 SSRI + Placebo Phase 2 30 days SSRI + L-methylfolate 15mg SSRI + L-methylfolate 15mg Group X is included in Phase 2 for the purpose of blinding but not in the study results. Groups 1 and 2 were pooled for L-methylfolate analysis and groups 3-5 were pooled for the placebo analysis.
Efficacy Results of Study II HDRS-17 Response Rates – 30 Days *p=0.04 (pooled) L-Methylfolate * Placebo % of Patients with 50% Reduction HDRS-17
Safety Results and Overall Discontinuation No Difference in Discontinuation Due to Adverse Events N/S % of Patient Discontinuation n = 1/42 n = 2/54 L-methylfolate patient was removed from the trial due to mood elevation. Patient’s medical history included bipolar disorder which was not detected at baseline.
HDRS-28 Treatment Effect by MTHFR C677T Genotype CC CT TT Phase I N = 39 18 6 Phase II N = 20 8 4
Summary: • L-methylfolate 15mg/day as adjunctive treatment to antidepressant therapy resulted in superior treatment outcome in 30 days (efficacy) compared to continued antidepressant therapy plus placebo in: • both co-primary outcome measures achieving statistical significance in: • response rates (50% ↓HDRS-17, p=0.04) • degree of improvement (Reduction in HDRS-17, p=0.05) • as well as in most secondary measures, including change in scores • QIDS-SR (p=0.04) • Clinical Global Impression Severity scale (CGI-S, p=0.01) • Obese patients (BMI > 30; HDRS-17, p = 0.02; CGI-S, p = 0.001) • Genetic variations of folate metabolism • Clinical management of MDD may be optimized with adjuvant L-methylfolate 15mg.