Download
1 / 34
340 likes | 352 Vues
Marine Life and Ecology. From Basics to the Extremophiles. Heterotrophy. Autotrophy. Food Chains on top of trophic levels and energy transfer. ... ecology, food chain, ecological pyramid, biology, pyramid of energy. Phytoplanktonic pigment concentration (mg C/m 2 per year). 10 1

E N D
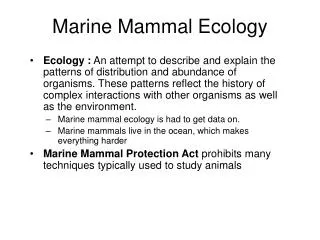
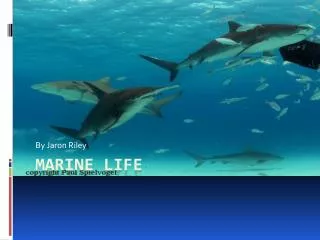
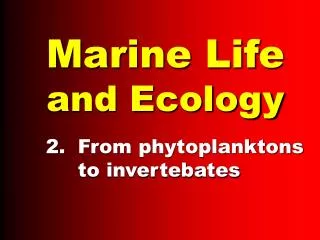
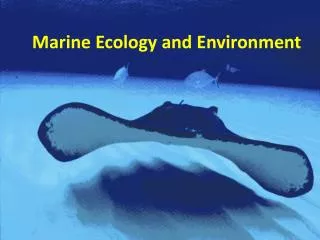
Marine Life and Ecology • From Basics to the • Extremophiles
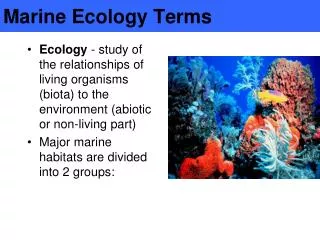
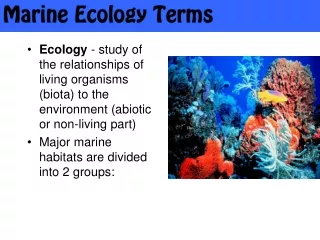
Heterotrophy Autotrophy Food Chains on top of trophic levels and energy transfer. ... ecology, food chain, ecological pyramid, biology, pyramid of energy
Phytoplanktonic pigment concentration (mg C/m2 per year) 10 1 0.8 0.6 0.4 0.2 0.1 Northern Hemisphere Summer Northern Hemisphere Winter
SeaWiFS Global Biosphere September 1997 - August 1998: This composite image gives an indication of the magnitude and distribution of global primary production, both oceanic (mg/m3 chlorophyll a) and terrestrial (normalized difference land vegetation index). Provided by the SeaWiFS Project, NASA/Goddard Space Flight Center and ORBIMAGE. From en:Image:Seawifs global biosphere.jpg Primary source: http://oceancolor.gsfc.nasa.gov/SeaWiFS/BACKGROUND/Gallery/index.html
Biological productivity in Land versus Oceanic Environments Average Productivity (g C/m2/yr) 160 50 Fraction of Earth’s Surface 28% 72% Total Production (tons of Carbon assimilation per year) 25 million 20 million Land Oceans
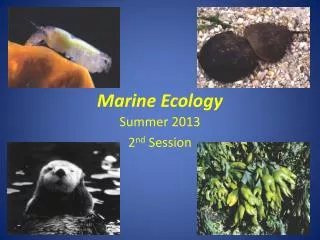
Planktons come in all sizes and shapes. Mostly, though, their shear helplessness has promoted such defensive strategies as schooling and transparency for avoiding the predators.
Average plant productivity in different Oceanic Environments Annual Productivity (g C/m2) 300 100 50 Fraction of Ocean Surface 0.1% 9.9% 90.0% Total Production (tons of annual C assimilation) 0.5 18.0 81.5 Upwelling Coastal Open Ocean
Ocean Habitats BiozonesLight zones Pelagic Photic Neritic OceanicTwilight BenthicAphotic Coral Reef After Dark See truly wild nightlife in this video from National Geographic. Video.NationalGeographic.com
LIGHT ZONES • photic, • twilight and • aphotic waters Depths at which the surface radiation of water is reduced to 10% and 1% for various colors in clear ocean water
Photosynthesis in the Terrestrial versus Marine Environments
Ocean Open ocean Continental margins Upwelling/ divergence areas Shallow estuaries, coral reefs Gross primary productivity (gC/m2/yr) <50 50-150 150-500 500-1250 Land Deserts Forests, grasslands, croplands Pastures, rain forests Swamplands, intensively developed farmland Gross primary productivity (gC/m2/yr) <50 50-150 150-500 500-1250
Phytoplanktons abound in the surface waters of continental shelves and upwelling and/or divergence areas, and tend to be scarce in the open ocean.
Zooplanktons distribution mimics that of the phytoplanktons, because zooplanktons are the primary consumers, and there-fore thrive in the waters where primary production is high.
Even the abundance of benthic animals of the ocean parallels the pattern of primary production.
Typical seasonal variations in the abundance of sunlight, nutrients, phytoplanktons and grazers (zooplanktons) in surface waters at …... Winter Spring Summer Fall Winter
Guess where these data are from? Productivity (gC/m2/day)
As Robert May (Scientific American, October 1992) has argued, most of the species display a predictable relation between physical size and population size: the smaller they are, the moreabundant they tend to be. 1 mm 1 cm 1 m Characteristic size (meters) Implication: More species < 1 mm await discovery than ones > 1 cm.
The Pompeii worm (Alvinella pompejana) can survive an environment as hot as 80° C (176° F) — nearly hot enough to boil water. The worm’s rear end sits in water as hot as 80° C (176° F), while its head, which sticks out of the worm’s tube home, rests in water that is much cooler, about 22° C (72° F). Formerly, the Sahara desert ant was believed to be the most heat-hardy creature, foraging briefly in the desert sun at temperatures up to 55° C (131° F).
The iceworm is one of many organisms in the seafloor ecosystem supported by naturally seeping hydro-carbons in the Gulf of Mexico. http://ocean.tamu.edu/Quarterdeck/QD5.3/macdonald.html
Resembling giant lipsticks, tubeworms (Riftia pachyptila) live over a mile deep on the Pacific Ocean floor near hydrothermal vents. They may grow to about 3 meters (8 ft) long. The worms’ white tube home is made of a tough, natural material called chitin (pronounced “kite-in”). These tubeworms have no mouth, eyes, or stomach (“gut”). Their survival depends on a symbiotic relation- ship with billions of bacteria that live inside them. These bacteria convert the chemicals that shoot out of the hydrothermal vents into food for the worm. This chemical- based food-making process is referred to as chemosynthesis.