Download
1 / 18
180 likes | 275 Vues
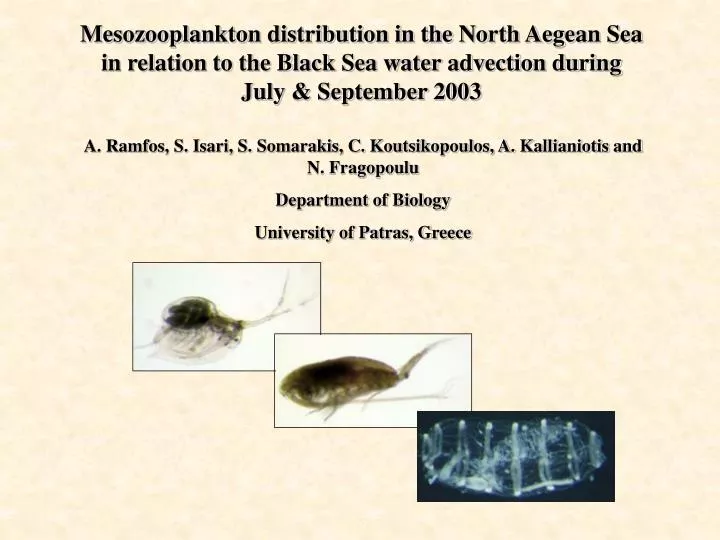
Mesozooplankton distribution in the North Aegean Sea in relation to the Black Sea water advection during July & September 2003. A. Ramfos, S. Isari, S. Somarakis, C. Koutsikopoulos, A. Kallianiotis and N. Fragopoulu Department of Biology University of Patras, Greece.

E N D
Mesozooplankton distribution in the North Aegean Sea in relation to the Black Sea water advection during July & September 2003 A. Ramfos, S. Isari, S. Somarakis, C. Koutsikopoulos, A. Kallianiotis and N. Fragopoulu Department of Biology University of Patras, Greece
Description and significance of the area Oligotrophic trend towards the South Aegean (Siokou-Frangou et al. 2002) Purpose of mesozooplankton study Investigation of mesozooplankton abundance, species composition and distribution patterns… …in relation to the main hydrological characteristics of the area. • Major fishing ground of • anchovy & sardine • Extended continental shelf • BSW influence • Riverine influence
WP2 net (200μm mesh, mouth area of 0.25 m2) • Opening closing mechanism • Haul speed 0.8-1.2 m/sec • Samples preserved in 4% borax-buffered formaldehyde solution (8<pH<9) • Estimation of zooplankton total abundance and biomass • Counting of zooplankton taxa • Identification of copepods and cladocerans to species level Zooplankton sampling Surveys were carried out onboard the oceanographic vessel “Aegaeo” July 2003 September 2003
Sampling grid • 32 mesozooplankton sampling stations (in a grid of 52 stations) • samples were collected in three distinct layers Layer July 2003 September 2003 0-50 m 32 32 50-100 m 9 7 100-200 m 3 3 Frontal area TOTAL 44 42
Hydrology of the area More saline and cold water of Levantine origin below 50m Homogenous temperature and salinity values below 50m Strong stratification of the water column during all surveys Seasonal thermocline - Less saline BSW in the surface layer
Hydrology of the area Fluorescence at 10m Salinity at 10m Temperature at 10m July 2003 September 2003
Hydrology of the area Salinity Temperature July 2003 September 2003
Mean mesozooplankton abundance and biomass Biomass (mg/m3) Abundance (ind/m3) • Mesozooplankton abundance and biomass values showed strong vertical decrease • Generally higher values in the summer period than autumn
3 3 1076 - 7810 ind/m 1076 - 7810 ind/m 3 542- 4895 ind/m 3 2.8 -14.8 mg/m 3 3.2 - 17 mg/m Horizontal distribution of total zooplankton abundance and biomass in the surface layer (0-50 m) July 2003 September 2003 Abundance Biomass
Mean relative abundance (%) of zooplankton groups: Layer 0-50 m 80% July 2003 3510 ind/m3 September 2003 2071 ind/m3
Mean relative abundance (%) of zooplankton groups: Layer: 50-100 m July 2003 1021 ind/m3 September 2003 522 ind/m3
Mean relative abundance (%) of zooplankton groups: Layer: 100-200 m July 2003 129 ind/m3 September 2003 78 ind/m3
Horizontal distribution of zooplankton groups: Layer: 0-50 m July 2003 Higher abundance values were observed in the coastal and/or frontal stations Copepods Cladocerans Doliolids Appendicularians Chaetognaths Salinity at 10m
Horizontal distribution of zooplankton groups: Layer: 0-50 m September 2003 Lower abundance values when compared to July (except copepods) More homogenous distribution of the dominant groups Copepods Cladocerans Doliolids Appendicularians Chaetognaths Salinity at 10m
Species assemblages – July & September 2003 A Epipelagic (0-50 m) B Intermediate (50-100 m) C Mesopelagic (100-200 m) July 2003 Acartia clausi Pseudoevadne tergestina Both surveys Oithona spp. Clausocalanus spp. Oncaea spp. C. vanus C. pergens Lucicutia flavicornis Pleuromamma spp. Scolecithricella spp. Both surveys Penilia avirostris Oithona spp. Clausocalanus spp. Paracalanus parvus Temora stylifera September 2003 Clausocalanus furcatus Evadne spinifera Oithona spp., Clausocalanus spp., Oncea media Farranula rostrata,Mesocalanus tenuicornis Ctenocalanus vanus,Centropages typicus July: P.avirostris – September: C. pergens 5 groups of samples according to season and sampling layer 58% similarity level – NMDS stress value: 0.13
Assemblages in the surface layer – July 2003 Coastal area Penilia avirostris, Oithona spp., Acartia clausi, Paracalanus parvus, Pseudoevadne tegrestina Gyre area Penilia avirostris, Oithona spp., Pseudoevadne tegrestina, Acartia clausi Frontal area Penilia avirostris, Oithona spp., Acartia clausi, Paracalanus parvus, Pseudoevadne tegrestina Farranula rostrata, Oncaea media
Assemblages in the surface layer – September 2003 Coastal area Acartia clausi, Paracalanus parvus, Penilia avirostris, Evadne spinifera Central area Penilia avirostris, Clausocalanus furcatus, Paracalanus parvus, Oithona spp. Southern area Low abundance values Low dominance High diversity
BSW inflow in the N. Aegean Hydrological variability Higher abundance and biomass when the inflow is higher e.g July Strong mesozooplankton variability Spatial Temporal 3 assemblages with respect to depth mainly cladocerans 3 assemblages in the horizontal plane related to gyres and frontal structures copepods Conclusions