Download
1 / 31
320 likes | 588 Vues
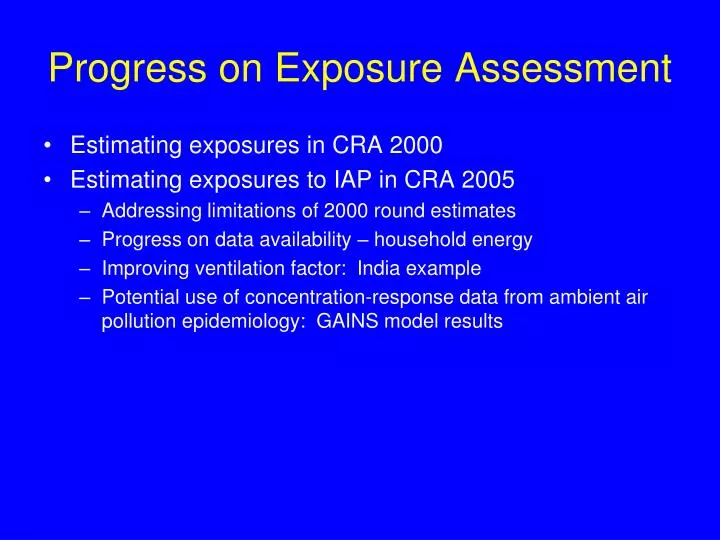
Progress on Exposure Assessment. Estimating exposures in CRA 2000 Estimating exposures to IAP in CRA 2005 Addressing limitations of 2000 round estimates Progress on data availability – household energy Improving ventilation factor: India example

E N D
Progress on Exposure Assessment • Estimating exposures in CRA 2000 • Estimating exposures to IAP in CRA 2005 • Addressing limitations of 2000 round estimates • Progress on data availability – household energy • Improving ventilation factor: India example • Potential use of concentration-response data from ambient air pollution epidemiology: GAINS model results
Health Effects • Relative risk estimates from epidemiologic studies based on crude exposure classifications of exposure (whether solid fuels used for cooking or heating) • Similar method used in most studies of ETS health effects • Why not use actual pollutant exposures, as done in outdoor air pollution? • Limited information: indoor concentrations in solid fuel using households and non-solid fuel using households • Difficulty of extrapolating from developed countries exp-resp studies outdoors
Estimating Exposures to IAP for Burden of Disease Estimation Exposed: • Households using solid fuels (wood, dung, agricultural residues, coal, charcoal) as primary source of energy for cooking • Unexposed: • Households not using solid fuels as primary cooking fuel (counterfactual level)
Estimating Household Fuel Use - 2000 CRA • Household Fuels Database • 52 countries in 10 WHO regions • Sources of data include: national population and housing censuses, household energy surveys, FAO • Estimates for each region are population weighted averages of available data • Filling in the Gaps: Fuel Prediction Model • Stepwise linear regression • Model parameters: stable over a several year period, available on a national level for most countries across most regions, routinely updated, from a reliable source • Model assumption: as countries develop, people gradually shift up an energy ladder from solid fuels to cleaner fuels and/or cleaner technologies • Brazil (1999 GNP per capita of $4420) richest country in the database with significant percentage of household solid fuel use. • All countries with 1999 GNP per capita > $5000 assumed to have made complete transition to clean household cooking systems
Final Fuel Prediction Model • Parameters: • Model Summary: • R: 0.8637 • R2: 0.7460 • Adjusted R2: 0.7244 • Standard Error of the Estimate: 0.1891 • Model meets assumptions of normalcy, constant variance. • Collinearity and Tolerance also assessed. ln GNP/cap Percent Rural Petroleum use/cap Eastern Mediter.
~500 million stoves CRA-2000 (Smith et al, 2004)
Scaling Up to the Regional Level Exposure to IAP from Solid Fuel Use: Solid fuels and Poor Ventilation / Inefficient stoves
Assigning ventilation factors Ventilation is a function of climate and development. Formerly Socialist Economies of Europe and Soviet Union • long history of household solid fuel use, under cold climatic conditions and relatively high standards of living • ventilation factor set to 0.2 China • national improved stove program (NISP) since 1983 • ventilation factor set to 0.5 for adult, 0.25 for children All other countries (45% of world population) • Ventilation factor set to 1.0
Addressing Limitations in 2005 Round • Uncertainty in solid fuel use model • Enough data available in nearly all regions to avoid modeling (~100 countries) • Urban vs. rural estimates of household energy use now available • Rough adjustment for ventilation can be improved • Quantitative data on cooking location, stove type and pollution level in India • Perhaps can be used to develop exposure estimates based on household survey parameters
Increase in Access to Routinely Available Data • Systematic inclusion of questions on household energy, cooking practices in WHS, LSMS, DHS, and MICS core questionnaires • In progress: development of comprehensive database on solid fuel use
World Health Survey(World Health Organization) • National in scope with target sample size of 5,000 • Probability sample (generally multi-stage cluster sampling) • Detailed questions on household energy: • Main fuel used for cooking • Open fire or stove, presence of chimney/hood, closed stove with chimney • Location of cooking – living area, separate kitchen, outdoors • Main fuel used for heating • Type of heating stove • Available for download from WHO website on country-by-country basis • Detailed questions on household energy included in 2003 data from 51 countries available
Fuel Use Questions on World Health Surveys
Living Standard Measurement Study(World Bank) • National in scope with samples typically between 3,000 and 10,000 • Sometimes multiple years but not the same HHs • Detailed questions on income and expenditures • Energy questions: • What is main fuel used for cooking (pick one) • Expenditures on LPG and kerosene • No questions on fuel collection time • May have question on stove chimney and stove location (Main cooking stove) • Available for download from World Bank website, but no table queries. Must work with raw data. • Extensive country coverage
Demographic and Health Surveys(USAID implemented by MACRO Intl) National in scope with samples typically between 3,000 and 10,000 Sometimes multiple years (but same HHs) No questions in income and expenditures, but detailed questions on household assets and amenities Energy Questions virtually the same as LSMS surveys. Available for download from website; some information is available from a query format and also raw data is available Extensive country coverage:results of > 200 surveys now available (multiple years in some countries)!
Multiple Indicator Cluster Survey (MICS) - UNICEF • MICS programme assists countries in filling data gaps for monitoring the situation of children and women through statistically sound, internationally comparable estimates of socioeconomic and health indicators. The household survey programme is the largest source of statistical information on children.
Specialized Energy Surveys • Regional scope with samples typically between 3,000 and 6,000 • Two with multiple years and the same HHs (Bangladesh and Vietnam) • Detailed questions on income and/or expenditures • Energy questions on all fuels for all purposes: • What source of energy does HH use (pick Mulitple) • Always questions on energy expenditures and collection time • Many times questions on energy use • May have question on stove chimney and stove location • Not available for download from World Bank website, and government permission is required for use unless part of World Bank work. • Limited Country Coverage: Recent countries are Bangladesh, Peru, Vietnam.
Other National Sources • Census surveys • National household surveys • National sample surveys, e.g., India
Low and Middle-Income 88% Coverage of Nationally Representative Household Surveys With Questions on Fuel Use Covered: 4994 million Missing: 684 million [still looking]
In progress: development of comprehensive database on solid fuel use estimates • To provide comprehensive information on household fuel use and cooking practices on a country-by-country basis • To enable flexible data input from various sources (e.g. household surveys, national censuses) • To automate flexible data output (e.g. country profiles, solid fuel use on a country-by-country or regional basis) • Coordinate with other groups interested in household fuel data (IEA, IBRD, WHO, IIASA, etc.)
Database input biomass fuels cleaner fuels solid fuels Open/closed stove Presence of chimney/hood Cooking location Fuel use disaggregated by maternal education and household wealth quintiles Sample draft output from WHO
Estimating contribution of indoor sources to outdoor concentrations • GAINS model (IIASA) • Used as input to ambient air pollution concentrations • Provides estimates of anthropogenic contributions to ambient concentrations • Will enable estimation of indoor ‘share’ of ambient concentrations, and application of concentration-response functions from ambient air epidemiology
PM2.5 concentrations for 2000 computed with GAINS/TM5Population-weighted annual mean concentrations (µg/m3) PM2.5 from anthropogenic primary PM emissions and secondary inorganic aerosols. Natural sources are excluded! Source: Markus Amman, IIASA
No forest fires Total 6600 gigagrams in 2000 BC Campaign Data
Indoor Air Pollution Stove, kitchen, ventilation Outdoor Emissions (climate and health) Emission Factors BC, PM, etc Socio-economic Development Expenditures, income, Groups Interested in Good Household Fuel Databases Household Fuel Use Basic Demographic Information
Improving the Ventilation Coefficient: India Example • 2 – 4 fold difference in 24 hour concentrations between states what ventilation factor / IAP concentrations (using 24 hour average PM10 as an indicator pollutant) should be assigned to solid fuel users in India? • Limited data on improved stove users • Large-scale studies at state level allows district level mapping of concentrations by fuel type and kitchen type • If measurements are available across several states (at least one in each agro-climatic zone), national level exposure estimates can be reliably reconstructed without the need for a measurement in each state
Daily average concentrations of PM10 in Andhra Pradesh Simple average 485 Concentrations in 3 districts Nizamabad ( 493) Rangareddy (378) Warangal (514) Weighted by proportion of households in each district by fuel and kitchen type and extrapolated to other districts 534
Work in progress • Update of global HH fuel database to include full set of survey results available • Refining ventilation coefficient • Update of global database of stoves, cooking locations • Map known concentrations to indirect measures of exposure in all areas where measurements are available • Estimating contribution of indoor sources to outdoor concentrations • Validation of GAINS model results (used in ambient air pollution CRA) with known concentration data