Download
1 / 24
240 likes | 436 Vues
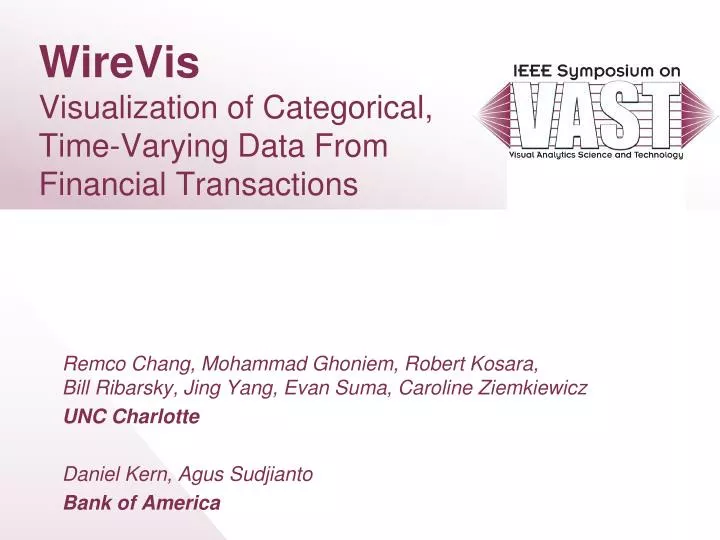
WireVis Visualization of Categorical, Time-Varying Data From Financial Transactions. Remco Chang, Mohammad Ghoniem, Robert Kosara, Bill Ribarsky, Jing Yang, Evan Suma, Caroline Ziemkiewicz UNC Charlotte Daniel Kern, Agus Sudjianto Bank of America.

E N D
WireVisVisualization of Categorical, Time-Varying Data From Financial Transactions Remco Chang, Mohammad Ghoniem, Robert Kosara, Bill Ribarsky, Jing Yang, Evan Suma, Caroline Ziemkiewicz UNC Charlotte Daniel Kern, Agus Sudjianto Bank of America
WireVis: Multi-National Collaboration Austria Robert Kosara Canada Caroline Ziemkiewicz USA Bill Ribarsky Evan Suma Daniel Kern (BofA) China Jing Yang Taiwan Remco Chang Egypt Mohammad Ghoniem Indonesia Agus Sudjianto (BofA)
WireVis:Disclaimer • Highly sensitive data • Involving individuals’ financial records • All names and specific strategies used by Bank of America have been removed from this presentation • Informative relating to Bank of America have been obscured • For example, instead of saying there are 215 transactions, I might say there are between 150-300 transactions.
WireVis:Why Fraud Detection? • Financial Institutions like Bank of America have legal responsibilities to the federal government to report all suspicious activities (money laundering, terrorist support, etc) • Monetary and operational penalties including the possibility of being shut down • Advantages? • Other than consumer trust, there is little to gain from fraud detection • Great for us! • Because there is no competitive advantage, the institutions are willing to work together • Everyone wants to do “best practice” • Viscenter Symposium
WireVis:Challenges to Financial Fraud Detection • Bad guys are smart • Automatic detection (black box) approach is reactive to already known patterns • Usually, bad guys are one step ahead • Evaluation is difficult • Financial Institutions do not perform law enforcement • Suspicious reports are filed • Turn around time on accuracy of reports could be long • Difficult to obtain “Ground Truth” • What is the percentage of fraudulent activities that are actually found and reported?
WireVis: Challenges with Wire Fraud Detection • Size • More than 200,000 transactions per day • “No a transaction by itself is suspicious” • Lack of International Wire Standard • Loosely structured data with inherent ambiguity London Singapore Charlotte, NC Indonesia
WireVis: Challenges with Wire Fraud Detection • No Standard Form… • When a wire leaves Bank of America in Charlotte… • The recipient can appear as if receiving at London, Indonesia or Singapore • Vice versa, if receiving from Indonesia to Charlotte • The sender can appear as if originating from London, Singapore, or Indonesia London Singapore Charlotte, NC Indonesia
WireVis:Using Keywords • Keywords… • Words that are used to filter all transactions • Only transactions containing keywords are flagged • Highly secretive • Typically include • Geographical information (country, city names) • Business types • Specific goods and services • Etc • Updated based on intelligence reports • Ranges from 200-350 words • Could reduce the number of transactions by up to 90% • Most importantly, give quantifiable meanings (labels) to each transaction
WireVis: Current Practice at Bank of America • Database Querying • Experts filter the transactions by keywords, amounts, date, etc. • Results are displayed in a spreadsheet. • Problems • Cannot see more than a week or two of transactions • Difficult to see temporal patterns • It is difficult to be exploratory using a querying system
WireVis:System Overview Search by Example (Find Similar Accounts) Heatmap View (Accounts to Keywords Relationship) Keyword Network (Keyword Relationships) Strings and Beads (Relationships over Time)
WireVis:Heatmap View • List of Keywords • Sorted by frequency from high to low (left to right) • Hierarchical Clusters of Accounts • Sorted by activities from big companies to individuals (top to bottom) • Fast “binning” that takes O(3n) • Number of occurrences of keywords • Light color indicates few occurrences
WireVis:Strings and Beads • Each string corresponds to a cluster of accounts in the Heatmap view • Each bead represents a day • Y-axis can be amounts, number of transactions, etc. • Fixed or logarithmic scale • Time
WireVis:Keyword Network • Each dot is a keyword • Position of the keyword is based on their relationships • Keywords close to each other appear together more frequently • Using a spring network, keywords in the center are the most frequently occurring keyword • Link between keywords denote co-occurrence
WireVis:Search By Example • Accounts that are within the similarity threshold appear ranked (most similar on top) • Target Account • Histogram depicts the occurrences of keywords • User interactive selects features within the histogram used in comparison • Similarity threshold slider
WireVis:Case Study Evaluation performed with James Price, lead analyst of WireWatch of Bank of America Dataset has been sanitized and down sampled Demo This system is generalizable to visual analysis of transactional data
Database SQL JDBC Stored Procedure Raw Data Temp Tables WireVis Client WireVis:Since March 31st (Vis Deadline)… • Scalability • We’re now connected to the database at Bank of America with 10-20 millions of records over the course of a rolling year (13 months) • Connecting to a database makes interactive visualization tricky • Unexpected Results • “go to where the data is” – operations relating to the data are pushed onto the database (e.g, clustering)
WireVis:Since March 31st… • Performance Measurements • Data-driven operations such as re-clustering, drilldown, transaction search by keywords require worst case of 1-2 minutes. • All other interactions remain real time • No pre-computation / caching • Single CPU desktop computer • WireVis is in deployment on James Price’s computer at WireWatch for testing and evaluation
WireVis:Future Work • Combine Visualization with Querying • Use text analysis (like IN-SPIRE) to automatically identify keywords • Relationships between Accounts • Seeing who send money to whom (over time) is important • Evaluation • Working with analysts, try to understand how they use the system and how to better their workflow • Tracking and Reporting • With tracking, we can make the analysis results “repeatable”, “sharable”, and “accountable”
WireVis:Lessons Learned • Financial Visual Analysis is Necessary! • Financial institutions have more data than they can comprehend. Using visualization to organize the data is a promising future direction. • Working with Financial Institutions Takes Patience • Dealing with sensitive data means more precautions are needed. • For good reasons, financial institutions are slow to change. • Gaining trust and credibility takes time • Lawyers, lawyers, lawyers • This paper has been nearly 2 years in the making… • Collaborate with the Financial Institution • Working with a data and systems expert at the institution makes development much more simple.
Questions and Comments? • Thank you! www.viscenter.uncc.edu
On a more personal note… • Just found out before the session that my brother and his wife just had their second daughter named Nola. Both mother and daughter are well!
WireVis:Design Principles • Interactivity • Visual analysis requires interacting with the data to see patterns and trends. WireVis is built using OpenGL to maximize interaction. • Filtering • With millions of transactions, the ability to filter out unwanted information is crucial. • Overview and Detail • Following Schneiderman’s mantra, the user needs to see overview and be able to drill down into detailed information. • Multiple Coordinated Views • No single information visualization tool can depict all aspects of a complex dataset, using correlated, coordinated views can piece together the big picture.
WireVis:System Demo • Interactivity • Filtering • Overview and Detail • Multiple Coordinated Views • Sample Analysis • In real-life scenarios, often the strongest clues are based on keyword relationships – the semantic understanding of keywords’ co-occurrences. • E.g. why does a company supposed dealing in goods ‘A’ sending money to a company that has to do with goods ‘B’?