Download
1 / 8
80 likes | 102 Vues
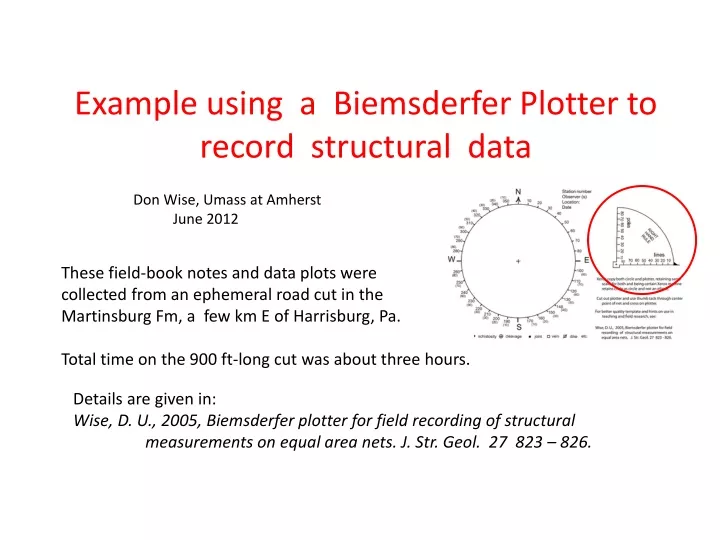
Example using a Biemsderfer Plotter to record structural data. Don Wise, Umass at Amherst June 2012. These field-book notes and data plots were collected from an ephemeral road cut in the Martinsburg Fm, a few km E of Harrisburg, Pa.

E N D
Example using a Biemsderfer Plotter to record structural data Don Wise, Umass at Amherst June 2012 These field-book notes and data plots were collected from an ephemeral road cut in the Martinsburg Fm, a few km E of Harrisburg, Pa. Total time on the 900 ft-long cut was about three hours. Details are given in: Wise, D. U., 2005, Biemsderfer plotter for field recording of structural measurements on equal area nets. J. Str. Geol. 27 823 – 826.
Template for Xeroxing field copy Be sure to maintain same scale on both pieces and check that the machine has not turned circle into an ellipse. Cut out plotter and use a thumb tack for rotation about center of net.
Use: Planes:pointer onto strike of plane, pole plotted on other axis. Lineations: down-plunge point plotted along pointer arm.
Field sketch of road cut made in notebook as part of data collection. Shape of whole cut with a few large features included was done while pacing off 100 ft sections and leaving a rock carin at each 100 ft location. Data collection and sketching proceeded along the outcrop face using these markers for approximate location control.
Field sheet plotted at end of first data traverse along crop, supplemented by additional details and measurements made while walking back along crop to check ages, etc. Also to fill in any partial girdles, to be certain about the two types and ages of cleavage, etc.
Summary of plot with descriptions of each of the structural elements listed in order of their development. DONE WHILE STILL ON THE OUTCROPso than any questionable items can be checked while critical contacts are photographed and/or sampled.
Final product done in office. Scanned copy of field plot became basal layer for ILLUSTRATOR program. Addiitional layers were used for each data type, a symbol made for that layer, copied and pasted in suitable numbers on the layer. Each was then dragged to the appropriate place on the field plot. A final layer was used for the lettering. Numbers indicate order of development of that feature.
Summary. Time spent on the outcrop may have been a bit longer than required by traditional methods but the resulting descriptions of features and their relative age relationships are far better. • The additional outcrop time, if any, is trivial compared to office time ordinarily spent trying to plot the data and remember the details, possibly having to revisit the outcrop for clarification. • Instead, the final data plot is complete, each elements is already described in the field notes, and age relationships are already in hand for checking samples against more detailed petrographic and instrumental analyses. Wise, D. U., 2005, Biemsderfer plotter for field recording of structural measurements on equal area nets. J. Str. Geol. 27 823 – 826.