Download
1 / 45
530 likes | 970 Vues
Usability Evaluation. Any analysis or empirical study of the usability of a prototype or system Goal is to provide feedback in software development in support of an iterative development process Recognize problems, understand underlying causes, and plan changes. Goals of Usability Evaluation.

E N D
Usability Evaluation • Any analysis or empirical study of the usability of a prototype or system • Goal is to provide feedback in software development in support of an iterative development process • Recognize problems, understand underlying causes, and plan changes
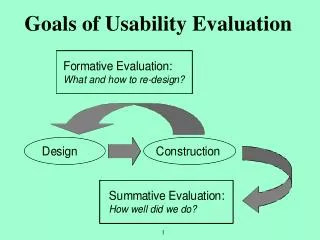
Goals of Usability Evaluation Formative Evaluation: What and how to re-design? Design Construction Summative Evaluation: How well did we do?
Formative and Summative Goals Formative: during development, guides process Summative: after development, or at a checkpoint • What sorts of “test data” aid formative goals? What about summative? • SBD relies on mediated usability evaluation • Claims analysis documents design features of concern • Users’ performance & reactions tied to these features, establishing a usability specification
Analytic and Empirical Methods Analytic: theory, models, guidelines (experts) Empirical: observations, surveys (users) “If you want to evaluate a tool, say an axe, you might study the design of the bit, the weight distribution, the steel alloy used, the grade of hickory in the handle, etc., or you might just study the kind and speed of the cuts it makes in the hands of a good axeman.” • Which is more expensive? Why? • Which carries more weight with developers? Why?
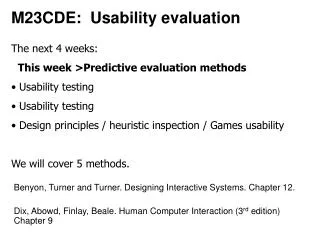
Usability Inspection • Expert walkthrough based on usability guidelines, often working from a checklist • Generally want more than one expert (if affordable!) • Guidelines (and walkthrough) can be at many levels • e.g., screen layout, detailed analysis of cognitive states • May or may not use a standard set of tasks • Depends on how comparable you want judgments to be • Summarize by listing problems identified in each category, also often rating them for severity
Heuristic Evaluation Multiple experts review with respect to these issues Can also include different classes of stakeholders, e.g. developers, users • Use simple and natural language • Speak the users’ language • Minimize memory load • Be consistent • Provide feedback • Provide clearly marked exits • Provide shortcuts • Provide good error messages • Prevent errors • Include good help and documentation
Cognitive Walkthrough • Form-based inspection of system/prototype • For general use systems (affordances, metaphors) • Careful task selection, answer questions at each step; e.g. How obvious is the next action? Must competing goals be ignored? Is knowledge assumed? • Check-list approach attractive to practitioners • Concerns with how to select the tasks for analysis, i.e. complexity/realism vs evaluation cost • In practice, often can be used in more lightweight fashion, more of a “tuning” to issues
Excerpt From Cognitive Walkthrough Form . . . Step [B] Choosing the Next Correct Action: [B.1] Correct Action: Describe the action that the user should take at this step. [B.2] Knowledge Checkpoint: If you have assumed user knowledge or experience, update the USER ASSUMPTION FORM. [B.3] System State Checkpoint: If the system state may influence the user, update the SYSTEM STATE FORM. [B.4] Action Availability: Is it obvious to the user that this action is a possible choice here? If not, indicate why. [B.5] Action Identifiability: [B.5.a] Identifier Location, Type, Wording, and Meaning: ______ No identifier is provided. (Skip to subpart [B.5.d] Identifier type: Label Prompt Description Other (Explain) Identifier wording: _______________________________________ Is the identifier’s location obvious? If not, indicate why. [B.5.b] Link Between Identifier and Action: Is the identifier clearly linked with this action? If not, indicate why. [B.5.c] Link Between Identifier and Goal: Is the identifier clearly linked with an active goal? If not indicate why. . . .
GOMS Analysis • Build predictive model using scientific knowledge about human memory and behavior • Like HTA, can analyze for complexity, consistency • Or build computational version, to estimate task times for different design alternatives • If successful, can provide huge benefit...why? • Extends general techniques of HTA • Goals, subgoals, plans, actions • BUT adds model elements for mental activities such as goal creation and selection, memory retrieval, etc.
Analytic Methods • Usability inspections are rapid, relatively cheap • Model-based approaches have good scientific foundation, are credible, can be very powerful
Downsides of Analytic Methods • Usability inspections are rapid, relatively cheap • But may miss details only seen in realistic use contexts involving real users, say little about what caused the problems, or expected impact • Model-based approaches have good scientific foundation, are credible, can be very powerful • But current theories have limited scope, and developing the models takes time/expertise
Empirical Evaluations: Validity • Conclusions based on actual use, BUT... • Are the users representative? • Is the test population large, diverse enough? • Is the test system realistic (early prototype)? • Do the tasks match what happens in real use? • Do the data (measures) reveal real life impacts? • These are the general concerns of “ecological validity”, the extent to which an investigation is a genuine reflection of real-world happenings
Field Studies • Variants of ethnographic methods we discussed during requirements analysis • Observation of realistic tasks, interviews, data files, etc. • Avoids the problem of ecological validity • Summarize data through content classification • e.g., problem categories, as in themes analysis • Can also sort by severity, based on observed impacts • Field data collection and analysis time-consuming • Also, much of the data simply reveals successful use!
Interviews, User Introspection • Ask users to report what stands • More efficient access to data of interest: critical incidents • Can enhance by making this collaborative, a discussion among usability personnel and multiple stakeholders • BUT, human memory is biased • Wanting things to make sense • Assuming things work as they always have
Usability Evaluation in the Lab • Carefully selected set of representative tasks • e.g., based on task analysis of the system, design goals • In SBD, claims are used to guide task selection • Control aspects of situation that are uninteresting • e.g., experimenter, location, task order, instructions • Collect multiple measures of usability impacts • Performance (time and errors), output quality • Satisfaction ratings or other subjective measures • Interpretation comes back to validity of the test • Both ecological (realism) and internal (controls)
VT Usability Lab • Partitioned into work, evaluation areas • Two-way mirrors allow observation • Machines support logging and screen capturing • Video recording and editing equipment
Controlled Experiments • If asking a specific question, making a choice • Operationalize independent and dependent variables • What is manipulated, what outcomes are measured • Define hypotheses in advance of the test • Causal relation of independent and dependent variables • Testing these requires the use of inferential statistics • Construct an effective and practical design • Within-subjects or between-subjects testing conditions • How many people to test, how assign to conditions
Some Variations • Usability testing with think-aloud instructions • Users comment as they work on their current goals, expectations, and reactions • BUT, thinking aloud takes capacity, changes task itself • Very useful in supporting formative evaluation goals • Storefront testing: bring the prototype into the hall! • Fast, easy, quick cycle...but no control of users, tasks • All of these can (should!) be supplemented with interviews and/or user reaction surveys • Objective measures of behavior not always correlated with subjective measures of experience or satisfaction
“Discount” Usability Evaluation • Goal: get the most useful information for guiding re-design with the least cost • Pioneered by Jacob Nielsen (heuristic inspection) • Do a little bit of each (analytic and empirical) • 3-4 experts find most of the guidelines issues • 4-6 users experience most of the actual use problems • Between the two, get a good sense of what to fix • Not surprisingly, a popular strategy, pretty much what you find in practice
Usability Specifications • Quality objectives for final system usability • like any specification, must be precise • managed in parallel with other design specifications • In SBD, these come from scenarios & claims • scenarios are analyzed as series of critical subtasks • reflect issues raised and tracked through claims analysis • each subtask has one or more measurable outcomes • tested repeatedly in development to assess how well project is doing (summative) as well as to direct design effort toward problem areas (formative) • Precise specification, but in a context of use
Activity, information, and interaction claims: identify key design features to be tested Usability specifications: a list of subtasks with performance and satisfaction parameters Design scenarios: extract motivation and context for subtasks to be tested Estimates of behavior: published or pilot data of expected user behavior
What about Generality? • Salient risk in focusing only on design scenarios • may optimize for these usage situations • the “successful” quality measures then reflect this • When possible, add contrasting scenarios • overlapping subtasks, but different user situations (user category, background, motivation) • assess performance satisfaction across scenarios • Motivation to construct functional prototypes as early as feasible in development cycle
A Sample Usability Specification • Where do targets come from? Serious, but not absolute • Notice that we can also “test” overarching scenario
Conducting a Usability Test • Recruiting of test participants • Preparation of materials • informed consent, background & reaction questionnaires, general and task-specific instructions, data collection • Test procedures • before, during, after; including assistance policy • Summarizing and interpreting the results
Recruiting Test Participants • Who are stakeholders, which ones are actors? • May mean different users for different tasks • Or, may mean users role-playing other stakeholders • How do you get people to participate?! • Participatory design, but this has its own downsides • Offer stipends or other rewards • Make test seem interesting, emphasize novelty • Last resort, hire from a temp agency... • Your project: • OK to ask friends, classmates, students • Choose people who can role-play scenario context
Informed consent • Always an issue when human subjects involved • The history: psychological research that deliberately deceives people, engages them in moral dilemmas, or is potentially harmful • The fix: procedures must be approved by a committee • Ensures respect for individuals’ concerns and hesitations about participating • Full disclosure of procedures (except when necessary) • Clear statement of voluntary nature, participant’s rights • Signature indicating understanding and willingness See p. 256 or the project web site for a model to use in developing your own informed consent form
User Background Questionnaire • Characterize the user sample you end up with • Relevant experience, expectations, starting attitudes • The question: are these the users you need to test? • But also, helps to interpret test results • E.G., Experienced computer users will likely do better • Domain experts may be more critical, more specific • A range of questions but not too long • Personal, demographic, experience, current attitudes • Shoot for one page, seems less intimidating, tedious See p. 258 for a model to use in developing your own user background survey
Developing User Rating Scales • Convenient for gathering subjective reactions • often summarized numerically by mapping judgment categories to ordinal variable (e.g. 1—>5) • flexible, can be very general or specific • can use to examine opinion change (post-pre) • Likert scale: measures strength of agreement to an assertion about the system or task domain Shopping for groceries online is enjoyable. Strongly Disagree Strongly Agree Disagree Neutral Agree
Task Instructions • General instructions that introduce overall test • Two sorts of instructions, depending on test type • Open-ended and goal-directed, for scenario exploration • These participants will be doing think-aloud process • Usage context followed by very precise goals for subtasks • Clear specification of the user’s goal • Avoid options or ambiguities unless part of the test • No step-by-step scripts: you are testing the system, not your ability to write complete instructions! See p. 254 & p. 259 for models to use in developing your own instructions
Notice that these instructions make assumptions about system state at each point.
Planning for Data Collection • Be prepared: know in advance what and how • One evaluator interacts with the user, the other keeps track of what happens, collects times, etc. • A structured form or template can be very useful • Take advantage of tools if available and easy to use • Video taping, screen capture, event logging, etc. • Particularly useful when collecting think-aloud data • Know when and how to intervene if necessary • A three stage assistance policy: “try again”, “look here”, and finally “just do this: ...” • Be ready to prompt (“what just happened?”) for users in the exploratory think-aloud condition
User Reaction Questionnaire • Critical for gathering subjective reactions • For small tests, interviews can also be even very useful • Similar in structure to background questionnaire • But no demographics this time • May include change in opinion due to test experience • Specific rating scales tied directly to target outcomes in the usability specifications • The “three best” or “three worst” features • Don’t forget the “anything else?” at the end See p. 261 for model to use in developing your own instructions
Results: Summarizing User Data • How you summarize depends on variable type: • Categorical: responses are classified into groups • Ordinal: responses fall in groups, but natural order • Interval: a scale with equidistant values • Ratio: numerical scale with defined zero value • Qualitative: comments to organize and discuss • Examples of each? • What are appropriate summary treatments of these differing kinds of variables?
Statistics • t-test • Compares 1 dep var on 2 treatments of 1 ind var • ANOVA: ANalysis Of VAriance • Compares 1 dep var on n treatments of m ind vars • Result: “significant difference” between treatments? • p = significance level (confidence) • typical cut-off: p < 0.05
Statistics in Microsoft Excel • Enter data into a spreadsheet • Go to Tools…, Data Analysis… (may need to choose Analysis Toolpak from Addins first) • Select appropriate analysis
t-tests in Excel • Used to compare two groups of data • Most common is “t-test: two-sample assuming equal variances” • Other t-tests: • Paired two-sample for means • Two-sample assuming unequal variances
ANOVAs in Excel • Allows for more than two groups of data to be compared • Most common is “ANOVA: Single factor analysis” • Other ANOVAs: • ANOVA: Two-factor with replication • ANOVA: Two-factor without replication
p < 0.05 • Found a “statistically significant difference” • Averages determine which is ‘better’ • Conclusion: • Vis Tool has an “effect” on user performance for task1 • PerspWall better user performance than Lifelines for task1 • “95% confident that PerspWall better than Lifelines” • Not “PerspWall beats Lifelines 95% of time” • Found a counterexample to the null hypothesis • Null hypothesis: Lifelines = PerspWall • Hence: Lifelines PerspWall
p > 0.05 • Hence, same? • Vis Tool has no effect on user performance for task1? • Lifelines = PerspWall ? • Be careful! • We did not detect a difference, but could still be different • Did not find a counter-example to null hypothesis • Provides evidence for Lifelines = PerspWall, but not proof • Boring! Basically found nothing • How? • Not enough users (other tests can verify this) • Need better tasks, data, …
Reporting Results • Often considered the most important section of professional papers • Statistics NOT the most important part of the results section • Statistics used to back up differences described in a figure or table
Reporting Means, SDs, t-tests • Give means and standard deviations, then t-test • … the mean number was significantly greater in condition 1 (M=9.13, SD=2.52) than in condition 2 (M=5.66, SD=3.01), t(44)=3.45, p=.01
What Are Those Numbers? • … the mean number was significantly greater in condition 1 (M=9.13, SD=2.52) than in condition 2 (M=5.66, SD=3.01), t(44)=3.45, p=.01 • M is the mean • SD is the standard deviation • t is the t stat • the number in parentheses is the degrees of freedom (df) • p is the probability the difference occurred by chance
Reporting ANOVAs • … for the three conditions, F(2,52)=17.24, MSE=4528.75, p<.001 • F(x,y) -- F value for x between groups and y within groups degrees of freedom (df) • MSE -- mean square error for the between groups condition • p -- probability that difference occurred by chance
Making Sense of the Results • Relate to high-level goals: is the system useful, easy to learn and use, satisfying? • Which of these is hardest to judge in lab study? • But also compare directly to usability specs: • Did you miss, meet, or surpass the target level? • More importantly, can you figure out why? • Guidance on how to change design comes from the details of the testing, not the summary values • Why was user confused (or not), why was an interaction difficult or awkward, etc.