Download
1 / 23
240 likes | 794 Vues
Cartogram of the Great Compromise. Mary Ann Polve Arizona Geographic Alliance Grade 8 and High School 1-2 Class Periods. Overview.

E N D
Cartogram of the Great Compromise Mary Ann Polve Arizona Geographic Alliance Grade 8 and High School 1-2 Class Periods
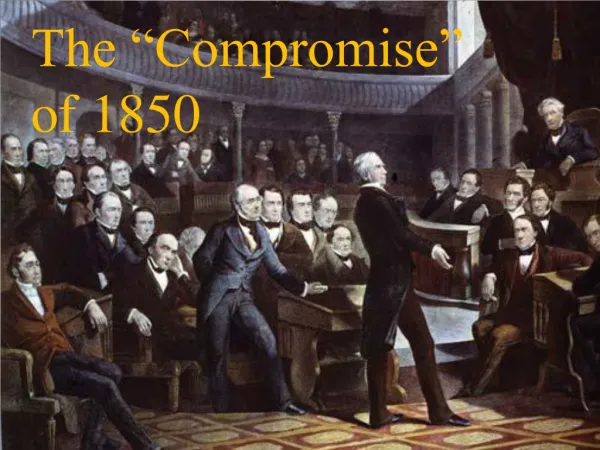
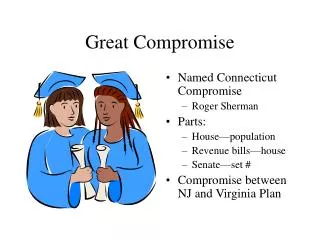
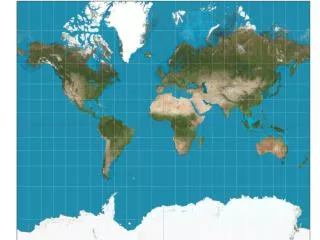
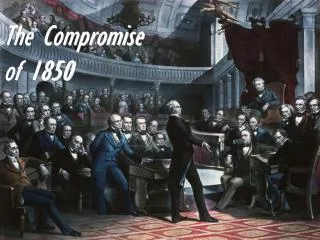
Overview The Great Compromise is a well-known event in early American history. As one might recall, at the Constitutional Convention in Philadelphia, a conflict arose between the “large” states and the “small” states. What is not often taught is which states were the “large” states and which states were the “small” states. Students who only have access to a standard map of the time might develop the mistaken concept that geographic size was the determining factor for “large” vs “small”. Creating a cartogram based on population will help clarify this concept.
Purpose In this lesson students will learn that a cartogram is a thematic map on which the size and shape of a country or state is distorted to represent a statistical value. Using the 1790 U.S. census data, students will create a cartogram of the population of the states that were in existence at that time and then visually determine which states were “large” states and which states were “small” states at the time of the writing of the Constitution.
National Geography Standards Element One: The World In Spatial Terms • How to Use Maps and Other Geographic Representations, Tools, and Technologies to Acquire, Process, and Report Information From a Spatial Perspective. • How to Use Mental Maps to Organize Information About People, Places, and Environments in a Spatial Context.
Element Four: Human Systems 9. The Characteristics, Distribution, and Migration of Human Population on Earth’s Surface. Element Six: The Uses of Geography 17. How to Apply Geography to Interpret the Past.
Arizona Geography Strand Concept 1 The World in Spatial Terms Grade 8 PO 1 Construct maps, charts, and graphs to display geographic information. PO 3 Interpret maps, charts and geographic databases using geographic information. High School PO 2 Interpret maps and images. PO 3 Use appropriate maps and other graphic representations to analyze geographic problems and changes over time.
Other Arizona Standards Strand 1 American History Grade 8 Concept 4 Revolution and New Nation PO 6 Describe how one nation evolved from thirteen colonies. • Constitutional Convention High School Concept 4 Revolution and New Nation PO 4 Analyze how the new nation government was created. c. Constitutional Convention
Strand 3 Civics/Government Grade 8 Concept 1 Foundations of Government PO 2 Analyze the purposes (e.g. weaknesses of the Articles of Confederation) and outcomes (e.g. compromises) of the Constitutional Convention. High School Concept 2 Structure of Government PO 2 Analyze the creation of the United States Constitution. a. representative government as developed by the Great Compromise and the Three-Fifths Compromise
ELA Common Core Standards Reading Standards for Literacy in History/Social Studies Grades 6-8 Key Ideas and Details 6-8.RH.2 Determine the central ideas or conclusion of a text, provide an accurate summary of the text distinct from prior knowledge or opinions. Grades 11-12 Key Ideas and Details 11-12.RH.2 Determine the central ideas or information of a primary or secondary source; provide an accurate summary that makes clear the relationships among the key details and ideas.
Objectives The student will be able to: • create a population cartogram using census data. • analyze factors in the Great Compromise using a cartogram.
Materials • The Great Compromise of 1787 handout • Student Note Sheet and Answer Key for the Great Compromise • Great Compromise Worksheet and Answer Key • United States in 1787 Map • 1790 Census Data Slave Population Cartograms to show students (2 different scales-1 to 1,000 and 1 to 10,000) • Cartogram Rubric • Graph Paper (1/4 inch grid works best) • Rulers (optional) • Colored Pencils (optional)
Procedures Session One 1. Distribute The Great Compromise of 1787 handout and the Student Note Sheet for the Great Compromise to the students.
Explain they are going to be filling out the Note Sheet as they read aloud and discuss the Great Compromise of 1787 handout. Also tell students to save this note sheet as they will be using it later. 2. As a class, read aloud and discuss the Great Compromise of 1787 handout. Give students time to fill in their Student Note Sheet.
3. After the Reading and note taking, distribute the Rubric for Population Cartogram, the 1790 Census Data Sheet, and graph paper.
Explain to students they will be creating a cartogram using the 1790 Census Data. Students probably have not seen a cartogram, so show them the one on Slave Population.
Explain that a cartogram is a thematic map, and that this one shows the states in proportion to their total slave population. First show the cartogram model with the 1 to 1,000 scale. Highlight how the general shape of the cartogram should mirror the actual shape of the states.
Then show the second model with the 1 to 10,000 scale. This one shows how planning is important. This model is too near the bottom of the page and too far to the right.
4. Instruct students that they are going to be making a cartogram of the states showing their total population for representation based on the Great Compromise using the 1790 Census Data sheet. The scale they will be using is 1 square on the grid equals 10 thousand people and that they are to round to the nearest grid. Go over the rubric so that the teacher may clarify any questions the students may have, then allow students to work on their cartogram. The cartogram will become homework if not completed in class.
Session Two1. Distribute the United States in 1787 map and the Great Compromise Worksheet.
Explain to students that they are to use the Note Sheet from the last session, the map given out in this session, and their population cartogram to complete the worksheet. This will be completed in class and collected for assessment. 2. Also collect the Population Cartogram for assessment. The Student Note Sheet may also be collected for assessment.
Assessment The Great Compromise Worksheet may be graded to assess civics, American history, and Common Core Standards using the Answer Key provided. There is a total of 32 points. Mastery would be considered 26 points (80%). Using the Cartogram Rubric provided, the Population Cartograms can be graded to assess the Geography Standards with 80 points (80%) being considered mastery. If the Student Note Sheet is assessed for civics, American history, and Common Core Standards, use the Answer Key provided. Mastery on it would be considered 14 points (80%) out of the 18 points possible.
Extensions • Students could create population cartograms of the North and the South prior to the Civil War. • Cartograms could also be created to show various resources (railroads, factories) or the population in the North and the South at the time of the Civil War.
Sources http://en.wikipedia.org/wiki/1790UnitedStatesCensus www.census.gov/ http://usgovinfo.about.com/uscongress/a/greatcom.htm http://incompetech.com/graphpaper/plain/