Download
1 / 15
150 likes | 307 Vues
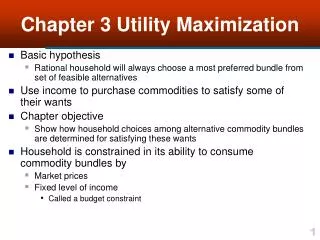
Lecture 6 Utility Maximization. Indifference Curve. Indifference Curve (IC) : It shows the combination of goods or services that yields the same level of utility.

E N D
Indifference Curve • Indifference Curve (IC): It shows the combination of goods or services that yields the same level of utility. • A consumer can purchase different combination of goods and services. Suppose he consumes two goods. We can construct different bundles with different combination of these two goods. We will conclude that two different bundles are in the same indifference curve if the consumer derives same level of satisfaction from these two bundles.
Example: Consider two goods X and Y. Now let us construct two bundles, bundle A= (X1, Y1) and bundle B= (X2, Y2) where X1 indicates the amount of good X and Y1 indicates the amount of good Y. Now if a consumer derives same level of satisfaction from both of the bundle then we conclude that the bundles are in the same IC. By connecting the bundles that gives the same level of utility we get the indifference curve.
Shift of Indifference CurveAn increase in utility is shown by a rightward shift of IC and a decrease in utility is shown by a leftward shift of IC. So in the figure IC3 shows higher utility than IC1 and IC2 shows lower utility than IC1.
MRS ( Marginal Rate of Substitution) • The slope of the indifference curve is known as MRS. It shows at what rate a consumer is willing to substitute one good for another good. • MRS= Slope of IC= ΔY/ΔX • So the Marginal Rate of Substitution shows that if we increase the quantity of good X ( by ΔX) then we need to decrease the quantity of good Y ( by ΔY) to keep the consumer’s utility constant.
Budget Constraint • Individuals have limited income or resource. That’s why we can’t consume unlimited amount of goods and services. The constraint in our income or budget is shown by budget line. • Budget Line: The budget line shows the combination of goods or services that a consumer can purchase given his limited income. • It is a downward sloping straight line. Suppose M= income X = amount of good X Px= Price of good X Y= amount of good Y Py= Price of good Y So the equation of budget line is Px*X + Py*Y= M
Slope of Budget Line The slope of the budget line is the price ratio of the goods. Why? So the equation of budget line is Px*X + Py*Y= M Rearrange the equation Py*Y= M- Px*X Y= M/Py- (Px/Py)*X In this equation • intercept is M/Py • slope is Px/Py where Px/Py is the price ratio of the good X and Y. • So we can conclude that the slope of the budget line is the price ratio of the two goods.
How to find utility maximizing bundle/ optimal bundle • A consumer if better off if he can reach to a higher indifference curve. • Due to the limited resource he has to be on the budget line. So our purpose is to find a combination/bundle of goods on the budget line that allows us to attain maximum utility. This bundle of goods is known as optimal bundle
Necessary Condition of Utility Maximization • Tangency Condition: Utility will be maximized if the budget line is tangent to IC. For any bundle where budget line cuts the IC will not be an optimal solution because there is a way to improve the utility by moving to higher IC. • Tangency condition implies that the slope of IC and budget line are same. • Slope of IC= MRS • Slope of budget line= Price Ratio= Px/Py • So the tangency condition of utility maximization is MRS= Px/Py So A is the optimal bundle that is the solution to the utility maximization
Impact of price change on budget line • If the price of one of the goods changes then the budget line will rotate. Case 1: If the price of one good is increased ( price of other good remains the same) then the budget line will rotate inward. Example: Suppose the budget line is 2X+ 2Y= 400. So the price of X is Px=2. Now if the price of X increases to Px=4 then the budget line will rotate inward.
Case 2: If the price of one good is decreased ( price of other good remains the same) then the budget line will rotate outward. • In the previous example if the price of good X decreases to Px=1 then the budget line will rotate outward
Impact of Price Change on Utility • Case 1: Price Increase will Lead to a Decrease in Utility: If the price of one good is increased then the budget line rotates inward. To find the impact of price increase on utility we need to find the new optimal bundle after the price increase. • First we draw the initial budget line and the indifference curve to get the initial optimal bundle ( IC1). Then we draw the new budget line which is found by rotating the initial budget line inward. Finally we shift the initial indifference curve inward to find the new optimal bundle. Usually in the new optimal bundle the amount of both goods will be decreased. So the utility level will decrease as the consumer is consuming less of both of the goods.
Case 2: Price Decrease will Lead to a Increase in Utility: If the price of one good is decreased then the budget line rotates outward. To find the impact of price decrease on utility we need to find the new optimal bundle after the price decrease. • First we draw the initial budget line and the indifference curve to get the initial optimal bundle ( IC1). Then we draw the new budget line which is found by rotating the initial budget line outward. Finally we shift the initial indifference curve outward to find the new optimal bundle. Usually in the new optimal bundle the amount of both goods will be increased. So the utility level will increase as the consumer is consuming more of both of the goods.
Impact of Income Change on Utility • Case 1: Increase in Income will Increase Utility When there is an increase in income the budget line shifts to the right. So we can find the optimal bundle by shifting the indifference curve to the right and finding the tangency point. Usually in the new optimal bundle the amount of both of the goods will be increased. So the utility level will be increased as the consumer is consuming more of both of the goods when the income increases. Example: In our example the budget line was 2X+ 2Y=400. So the income is 400. Now if the income increases to 800 then the budget line shifts to the right.
Case 2: Decrease in Income will Decrease Utility When there is an decrease in income the budget line shifts to the left. So we can find the optimal bundle by shifting the indifference curve to the left and finding the tangency point. Usually in the new optimal bundle the amount of both of the goods will be decreased. So the utility level will be decreased as the consumer is consuming less of both of the goods when the income decreases. • Example: In our example the budget line was 2X+ 2Y=400. So the income is 400. Now if the income decreases to 200 then the budget line shifts to the left.