Download
1 / 16
160 likes | 336 Vues
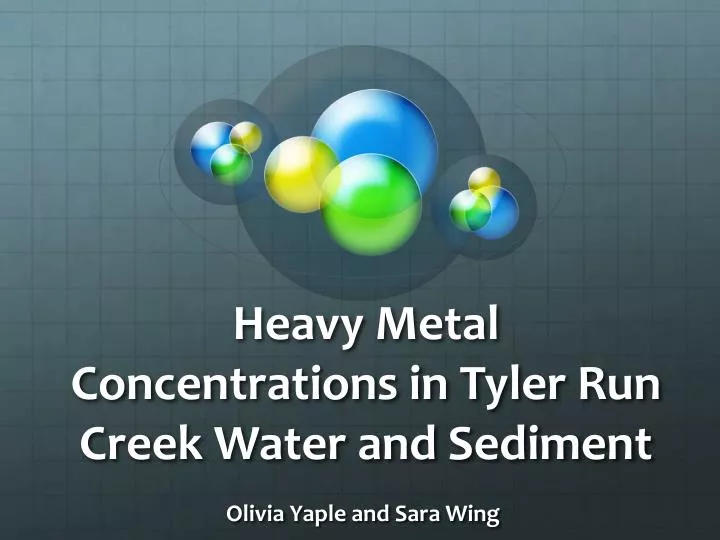
Heavy Metal Concentrations in Tyler Run Creek Water and Sediment. Olivia Yaple and Sara Wing. Background. Water and sediment contamination is important to study due to its potential adverse affects on public water supply quality and aquatic life 1

E N D
Heavy Metal Concentrations in Tyler Run Creek Water and Sediment Olivia Yaple and Sara Wing
Background • Water and sediment contamination is important to study due to its potential adverse affects on public water supply quality and aquatic life1 • Cd in particular can permeate calcium channels of aquatic vegetation and disrupt the plant water status2
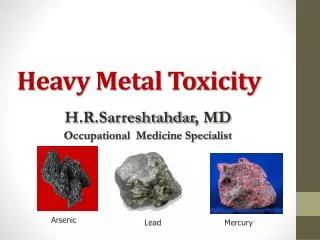
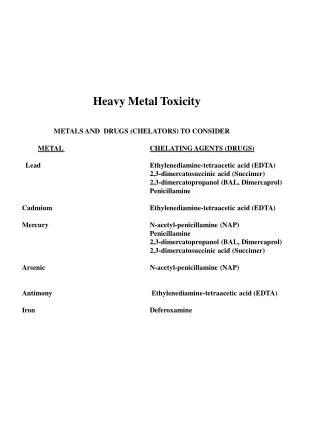
Background, Cont. • Cd, Pb, Cu, and Zn are heavy metals commonly found in water and sediment samples that can reach toxic levels3 • These heavy metals can precipitate in an aquatic system and deposit in sediment, or end up there via sedimentation4
Background, Cont. • ICP and AA are both used to determine metal concentrations in aqueous solutions • EPA freshwater quality recommendations:5
Hypotheses • Water from farther downstream would have higher concentrations of all metals while farther upstream would have lower concentrations. • Sediment from farther downstream would have higher metal concentrations than farther upstream • Sediment metal concentrations would be higher than water metal concentrations.
Method • Water samples were collected from Tyler Run creek at 10 foot and 50 foot increments upstream and downstream of the ford • Sediment samples were collected from the same area and extracted • Samples were analyzed using ICP and AA
Extraction Method • A funnel filled with filter paper was filled with 1.5 cm of sediment and let sit until dry • The dry sample was washed twice with 5 ml quantities of 0.1M HNO₃ and let dry after each wash. The filtrate was collected in 100 ml volumetric flasks • The filtrate was diluted to 100 ml using deionized water therefore all found concentrations were 10 times less than actual concentration
Standards • 5 ppm, 10 ppm, 15 ppm, and 20 ppm standards of Cd, Pb, Cu, and Zn were prepared via the following dilution method: 10 ppm = 1 ml of 1000 ppm stock solution 100 ml DI water • ICP used standards containing all metals • AA used separate standards for each metal
Method, Continued • For both instruments, the run order was: • 1) Blank • 2) 5ppm standard • 3) 10ppm standard • 4) 15ppm standard • 5) 20ppm standard • 6) Water 50 ft downstream • 7) Water 10 ft downstream • 8) Water 10 ft upstream • 9) Water 50 ft upstream • 10) Sediment 50 ft downstream • 11) Sediment 10 ft downstream • 12) Sediment 10 ft upstream • 13) Sediment 50 ft upstream • 14) Spiked sample
Proving the Method • Using the spiked samples’ results, the method was proved • For ICP, the sample of 10 ft downstream water was spiked with 25 ppm Pb. The results showed 24.253 ppm. • 24.253 ppm x 100 % = 97.012 % recovery 25 ppm
Proving the Method, Cont. • For AA:
Proving the Method, Cont. • Based on the high percent recoveries for both ICP and AA, we postulate that both instruments were detecting all four metal concentrations, though the AA could not detect the metal concentrations in the samples • Therefore, all results reported are based on ICP data
Results *denotes a metal concentration in excess of the EPA recommended limits
Conclusions • Results showed that sediment samples overall had much higher Cd, Pb, Cu, and Zn concentrations than water samples • For sediment samples, farther downstream samples had the highest metal concentrations • For water samples, Cd had the highest concentrations downstream, Zn showed the same pattern, but was not over the EPA limit.
Discussion • ICP Cu data provided some negative values, these are explained by the Cu concentrations being below the detectable limit of 0.002 ppm5 • Possible sources of error include but are not limited to: • skewed calibration curves • Non-standardized sample procurement • Many samples contained heavy metal concentrations close to the detection limit
References • 1Saygi, Y.; Yiğit, S. A. Heavy metal concentrations in Yeniçağa Lake and its potential sources: Soil, water, sediment, and plankton. Environ. Monit. Assess. 2012, 184, 1379-1389. • 2Perfus-Barbeoch, C.; Leonhardt, N.; Vavasseur, A.; Forestier, C. Heavy metal toxicity: Cadmium permeates through calcium channels and distrubs the plant water status. Plan. Jour. 2002, 32(4), 539-548. • 3Filgueiras, A. V.; Lavilla, I.; Bendocho, C. Chemical sequential extractions for metal partitioning in environmental solid samples. J. Environ. Monit. 2002, 4, 823-857. • 4Avil-Peréz, P.; Balcázar, M.; Zarazia-Ortega, G.; Barceló-Quintal, I.; Díaz-Delgado, C. Heavy metal concentrations in water and bottom sediments of a Mexican reservoir. Sci. of the Tot. Environ. 1999, 234(1-3), 185-196. • 5United State Environmental Protection Agency. National Recommended Water Quality Criteria. http://water.epa.gov/scitech/swquidance/standards/current/index.cfm (accessed April 25, 2012).