Download

1 / 27
270 likes | 392 Vues
BRINGING THE TOOLS TOGETHER. Glenn Patterson. 2002 Report to Congress. How do we measure water availability?. At its core, a water availability assessment tells us the status and trends in storage volumes, flow rates, and uses of water for a given area. Water quality must be considered.

E N D
BRINGING THE TOOLS TOGETHER Glenn Patterson
How do we measure water availability? • At its core, a water availability assessment tells us the status and trends in storage volumes, flow rates, and uses of water for a given area. • Water quality must be considered.
Flow Rates means… • Runoff • Recharge • Evapotranspiration • Interbasin transfers, and • Other components of the water cycle
And speaking of runoff monitoring… • Each year some new streamgages are installed and some are discontinued. • Even with the increases we are likely to see a net reduction in the size of the network due to reductions in budgets of our funding partners. • Many of the discontinued streamgages have long periods of record.
Water Availability as a National Issue • CENR Subcommittee on Water Availability and Quality (SWAQ) • ‘05 Report-Science and Technology to Support Freshwater Availability • http://www.ostp.gov/NSTC/html/swaqreport_2-1-05.pdf • Upcoming report—Spring 2007 • Working Groups
SWAQ Working Groups(so far) • Microbial Source Tracking • Improve Hydrologic Prediction Models and Their Applications • Collaborative Tools and Processes for US Water Solutions
Water Availability in the West USGS Circular 1261 by M.T. Anderson and L.H. Woosley (Published in 2005) http://pubs.usgs.gov/circ/2005/circ1261/
Many of the same issues discussed on today’s agenda, plus… • Patterns of ground-water declines
Water quality and habitat issues • Urbanization • Irrigation return flows • Naturally occurring arsenic • Saltcedar • Mines • Endangered species, biodiversity, and habitat
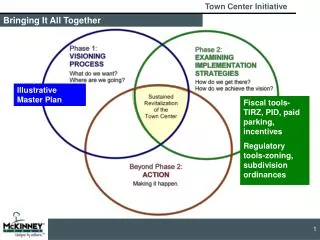
Making the information useful to Managers We’ve seen a variety of tools and techniques that can help determine water availability. How can the information be summarized in a useful way for water managers?
USGS Water Availability Screening Tool Cooperator : Pennsylvania Department of Environmental Protection Courtesy of: Marla Stuckey, USGS, Pennsylvania
Pennsylvania Water Resources Planning Act (Act 220) • Passed in 2002 • Tasks include: • Assess surface and groundwater resources • Assess existing and projected water use • Identify critical water planning areas • Create critical area resource plans
Screening Tool Development • Surface Water Availability • Determined by 7-Day, 10-Year low-flow statistic and net water use within a basin • Determined for approximately 10,000 watersheds • Pour points of watersheds colored to indicate water availability • PaDEP managers will be able to edit water use at pour points • Projected future demands • Requested water use • Supplemental water use data
Screening Tool Development 3 Major Components: • Hydrologic, statistical, and water-use data • Development of regression equations • Compilation of water use data • Spatial data elements for geographic analysis • GIS data preparation – 10m DEMs • User system to access the water-planning information • Desktop application
Available Desktop Application Functions • Show Basin • Edit Basin • Fraction Supply • Recalc Selected Area • Save Scenario • Load Saved Scenario • Reload to Baseline • Recalc Entire
Recalculate water availability to determine effects of edits on downstream pour points Recalculate Function
Percent Supply Function 100% 7Q10 50% 7Q10
What do YOU think? • Will these tools help you? • What information do you need to understand and manage your State’s water availability?