Download
1 / 69
690 likes | 799 Vues
Part III The General Linear Model Chapter 10 GLM. ANOVA. Chapter 10.1. Single Sample t-test. GLM, applied to ANOVA Single Sample t-test. Sleep data example. William Sealy Gosset AKA Student. V. 1. Construct Model. D. F. G. Verbal Drug A increases time slept. Graphical model

E N D
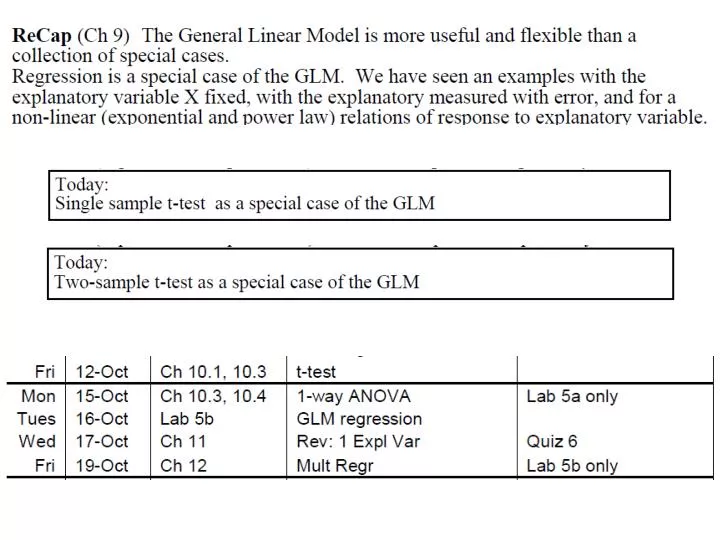
Chapter 10.1 Single Sample t-test
GLM, applied to ANOVA Single Sample t-test. Sleep data example William Sealy Gosset AKA Student
V 1. Construct Model D F G • Verbal • Drug A increases time slept. • Graphical model • Define quantity of interest T = TDrugA – TControl
V 1. Construct Model D F G • Formal • Response: • Explanatory: • Formal:
3. Evaluate Model • Straight line model ok? • Errors homogeneous? • Errors normal? • Errors independent?
3. Evaluate Model NA • Straight line model ok? • Errors homogeneous? • Errors normal? • Errors independent?
3. Evaluate Model NA • Straight line model ok? • Errors homogeneous? • Errors normal? • Errors independent? NA
3. Evaluate Model NA • Straight line model ok? • Errors homogeneous? • Errors normal? • Errors independent? NA
3. Evaluate Model NA • Straight line model ok? • Errors homogeneous? • Errors normal? • Errors independent? NA
4. State population and whether sample is representative. Differences in time slept relative to control for all possible subjects All possible differences in time slept relative to control, given the experimental protocol Differences in time slept relative to control, given the experimental protocol
5. Decide on mode of inference. Is hypothesis testing appropriate? • Does Drug A affect hours of sleep? • Don’t know if the answer is yes or no 6. State HA / Ho pair, with tolerance for Type I error • HA: • Ho: • State test statistic: • Distribution of test statistic: • Tolerance for Type I error:
8. Recompute p-value if necessary. • Assumptions met so no need to recompute 9. Declare and report decision about model terms (compare p to α). • p = 0.218 < α = 0.05, so reject HA: βo ≠ 0 • Report decision: • There is no significant difference in extra time slept, for drug A (F1,9= 1.76, p = 0.218) • But might Type II error be a problem here?
9. Declare and report decision about model terms (compare p to α). • There may be a difference, but it is hidden in the variance • Power analysis: • Compute the minimum detectable difference • T = 0.75 hours F = 1.76 p = 0.218 • T = 1.00 hours F = 3.12 p = 0.111 • T = 1.25 hours F = 4.88 p = 0.054 • T = 1.28 hours F = 5.12 p = 0.050
9. Declare and report decision about model terms (compare p to α). • Another experiment, with more subjects, should be considered before concluding there is no evidence of an effect • Power analysis: • Compute sample size needed to detect a difference • n = 10 F = 1.76 p = 0.218 • n = 20 F = 3.71 p = 0.0692 • n = 24 F = 4.49 p = 0.0451
10. Report and interpret parameters of biological interest. • Parameters are not of interest there because there appears to be no difference • BUT, with this sampling effort and variability, the study needs to be repeated to be conclusive.
Chapter 10.2 Two Sample t-test
GLM, applied to ANOVA Two Sample t-test. Sleep data example William Sealy Gosset AKA Student
V 1. Construct Model D F G • Verbal • Extra time slept depends on drug • Graphical model • Formal model • Response: • Explanatory: Measurement scale?
2. Execute analysis lm1 <- lm(diff~drug, data=drugs) Parameter estimates Based on output: GLM routine:
2. Execute analysis lm1 <- lm(diff~drug, data=drugs) Parameter estimates Based on output: GLM routine:
3. Evaluate Model • Straight line model ok? • Errors homogeneous? • Errors normal? • Errors independent?
3. Evaluate Model NA • Straight line model ok? • Errors homogeneous? • Errors normal? • Errors independent?
3. Evaluate Model NA • Straight line model ok? • Errors homogeneous? • Errors normal? • Errors independent?
3. Evaluate Model NA • Straight line model ok? • Errors homogeneous? • Errors normal? • Errors independent?
3. Evaluate Model NA • Straight line model ok? • Errors homogeneous? • Errors normal? • Errors independent? X
3. Evaluate Model NA • Straight line model ok? • Errors homogeneous? • Errors normal? • Errors independent? X
4. State population and whether sample is representative. • All possible differences in time slept relative between the two groups 5. Decide on mode of inference. Is hypothesis testing appropriate? • Yes. The question is whether one drug is better than the other. • It is not clear whether the greater hours of sleep due to the one drug is more than just chance.
6. State HA / Ho pair, with tolerance for Type I error • HA: • Ho: • State test statistic: • Distribution of test statistic: • Tolerance for Type I error:
8. Recompute p-value if necessary. • When assumptions not met, recompute if: • n small (n = 19, so _____) • p near α (p =0.079, so _____) • Colquhoun (1971) carried out a randomization test • p = 0.0813 (976/12000)
9. Declare and report decision about model terms (compare p to α). • p = 0.0813< α = 0.05, so reject HA • Report decision: • There is no significant difference in extra time slept for the two drugs (F1,18= 3.46, p = 0.081) • Again, Type II error may be a problem • Run a Power Analysis to guide future study
10. Report and interpret parameters of biological interest. • Parameters are not of interest there because there appears to be no difference • BUT, with this sampling effort and variability, the study needs to be repeated to be conclusive. • The inclusion of 10 more samples may allow the detection of a significant difference
Chapter 10.3 One way ANOVA, Fixed Effects
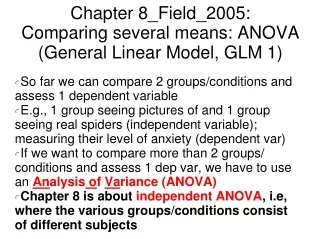
GLM, applied to ANOVA One way ANOVA, Fixed Effects • Pea section growth data, from Box 9.4 in Sokal and Rohlf (1995). • Does growth depend on treatment (control versus 4 different sugars with auxin present)? ε + =
1. Construct Model • Verbal • Pea section length in treated groups differ from the control (untreated) group. • Graphical model • Formal model • Response: • Explanatory: • Fixed effect ↗ Measurement scale?
2. Execute analysis lm1 <- lm(len~trt, data=peas) Parameter estimates
3. Evaluate Model • Straight line model ok? • Errors homogeneous? • Errors normal? • Errors independent?
3. Evaluate Model NA • Straight line model ok? • Errors homogeneous? • Errors normal? • Errors independent?
3. Evaluate Model NA • Straight line model ok? • Errors homogeneous? • Errors normal? • Errors independent?
3. Evaluate Model NA • Straight line model ok? • Errors homogeneous? • Errors normal? • Errors independent?
3. Evaluate Model NA • Straight line model ok? • Errors homogeneous? • Errors normal? • Errors independent?
3. Evaluate Model NA • Straight line model ok? • Errors homogeneous? • Errors normal? • Errors independent?
3. Evaluate Model NA • Straight line model ok? • Errors homogeneous? • Errors normal? • Errors independent?
4. State population and whether sample is representative. • Population is all possible measurements, given the method of applying treatments and the protocol for taking measurements. • It is taken to be representative (i.e. not biased) 5. Decide on mode of inference. Is hypothesis testing appropriate? • Yes. We want to know if there are any differences between treatments • ANOVA tells us if there are ANY differences in variance among groups