Download
1 / 72
720 likes | 872 Vues
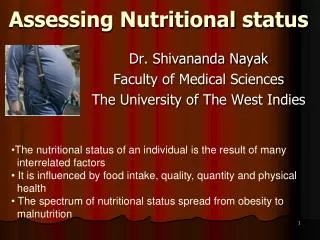
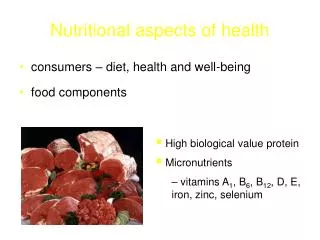
Assessing the Nutritional Health of Populations. Some Definitions. Joint Nutrition Monitoring Evaluation Committee, 1986 Expert Panel on Nutrition Monitoring, 1989. Dietary Status. The condition of a population’s or an individual’s intake of foods and food components, especially nutrients.

E N D
Some Definitions Joint Nutrition Monitoring Evaluation Committee, 1986 Expert Panel on Nutrition Monitoring, 1989
Dietary Status • The condition of a population’s or an individual’s intake of foods and food components, especially nutrients.
Nutrition Assessment • Measurement of indicators of dietary status and nutrition related health status to identify the possible occurrence, nature, and extent of impaired nutritional status.
Nutrition Monitoring • Assessment of dietary or nutrition status at intermittent times with the aim of detecting changes in the dietary or nutritional status of a population
Nutrition Surveillance • Continuous assessment of nutritional status for the purpose of detecting changes in trend or distribution in order to initiate corrective measures
Goals of NNMS • Provide foundations for improvement of nutritional status and quality and healthfulness of food supply • Collect, analyze, and disseminate timely data on nutrition and dietary status, quality of food supply, food consumption patterns, consumer knowledge and attitudes
NNMS Goals, cont... ID high risk groups and geographic areas and trends Establish national baseline data and develop standards for monitoring Provide data for evaluating implications of changes in agricultural policy
NNMS - Some Agencies • USDA • Food and Nutrition Service • Food Safety and Inspection Service • Agricultural Research Service • Economic Research Service • Extension Service • Cooperative State Research Service
Department of Health and Human Services • National Center for Health Statistics • CDC-National Center for Chronic Disease Prevention and Health Promotion • Food and Drug Administration • Heath Resources and Services Administration • Indian Health Services • National Institutes of Health • Substance Abuse and Mental Health Services Administration
Others: • Department of Defense • Department of Education • Agency for International Development • Department of Veterans Affairs • Census Bureau • Bureau of Labor Statistics • National Marine Fisheries Service
Nutrition and Related Health Measurements • National Health and Nutrition Examination Surveys (I-V, and continuous) • National Health Interview Survey • National Hospital Discharge Survey • Pediatric Nutrition Surveillance System
Food and Nutrient Composition • Nationwide Food Consumption Survey • Continuing Survey of Food Intakes by Individuals – now integrated into What We Eat in America
Knowledge, Attitudes, and Behavior • Behavioral Risk Factor Surveillance System • Youth Risk Behavior Survey • Diet and Health Knowledge Survey
Food Composition and Nutrient Data Bases • National Nutrient Data Bank (NNDB)
Food Supply Determinations • US Food and Nutrition Supply Series • Interactive web site for nutrient content of the US food supply from 1909 to 2006: http://65.216.150.146/ • Gerrior & Bente. Dietary Guidance, 1970 to 1999: Does the U.S. Food Supply Support It? Family Economics and Nutrition Review. 2002
Behavioral Risk Factor Surveillance System (BRFSS) • CDC, National Center for Chronic Disease Prevention and Health Promotion (NCCDPHP) • Annually since 1984 (not all states at first) • Telephone interview • Data collection is conducted separately by each State. Sample design uses State-level, random-digit-dialed probability samples of the adult (aged 18 years and over) population. • State-specific sample sizes ranged from 1,499 to 6,005
BRFSS - Questions • Behavioral risk factors (for example, alcohol and tobacco use), preventive health measures, HIV/AIDS, health status, limitation of activity, and health care access and utilization • Core of questions asked in all States • Standardized optional questions on selected topics administered at the State’s discretion • Rotating core of questions asked every other year in all States • State-added questions developed to address State-specific needs
BRFSS - Data • National • State • Smaller units when local agencies pay for additional surveys • Data system homepage: http://www.cdc.gov/brfss/
BRFSS - Nutrition • Self reported height and weight • Trying to loose weight? • 6 fruit and vegetable intake questions • Activity • Food security
The Youth Risk Behavior Surveillance System (YRBSS) National, State, and Local Data
Purposes of the YRBSS • Focus the nation on behaviors among youth causing the most important health problems • Assess how risk behaviors change over time • Provide comparable data
Behaviors That Contribute to the Leading Causes of Morbidity and Mortality • Behaviors that contribute to unintentional injuries and violence • Tobacco use • Alcohol and other drug use • Sexual behaviors • Unhealthy dietary behaviors • Inadequate physical activity
Characteristics of the National, State, and Local School-Based YRBS • 2007 sample was 14,041, 9th – 12th grade students • 2007 response rates • School = 81% • Student = 84% • Overall 68% • Anonymous, computer-scannable questionnaire or answer sheet • Completed in one class period (45 minutes) • Conducted biennially usually during the spring
Policy and Program Applications • Describe risk behaviors • Create awareness • Set program goals • Develop programs and policies • Support health-related legislation • Seek funding
YRBS - Nutrition • Self reported weight and height • Dieting behaviors • Eating disorder behaviors • Fruit and vegetable intake • Fat intake
Percentage of High School Students Who Ate Fruits and Vegetables Five or More Times/Day,* by Sex** and Race/Ethnicity,*** 2007 * 100% fruit juices, fruit, green salad, potatoes (excluding French fries, fried potatoes, or potato chips), carrots, or other vegetables during the 7 days before the survey. ** M > F*** B, H > W National Youth Risk Behavior Survey, 2007
Percentage of High School Students Who Ate Fruits and Vegetables Five or More Times/Day,* 1999 – 2007 * 100% fruit juices, fruit, green salad, potatoes (excluding French fries, fried potatoes, or potato chips), carrots, or other vegetables during the 7 days before the survey. 1 Decreased 1999-2007, p < .05 National Youth Risk Behavior Surveys, 1999 – 2007
Percentage of High School Students Who Drank Three or More Glasses/Day of Milk,* by Sex** and Race/Ethnicity,*** 2007 * During the 7 days before the survey. ** M > F*** W > H > B National Youth Risk Behavior Survey, 2007
Percentage of High School Students Who Drank Three or More Glasses/Day of Milk,* 1999 – 2007 * During the 7 days before the survey. 1 Decreased 1999-2007, p < .05 National Youth Risk Behavior Surveys, 1999 – 2007
Percentage of High School Students Who Drank a Can, Bottle, or Glass of Soda or Pop at Least One Time/Day,* by Sex** and Race/Ethnicity,*** 2007 * Not including diet soda or diet pop, during the 7 days before the survey. ** M > F*** B > H National Youth Risk Behavior Survey, 2007
Percentage of High School Students Who Did Not Eat for 24 or More Hours to Lose Weight or to Keep From Gaining Weight,* by Sex** and Race/Ethnicity,*** 2007 * During the 30 days before the survey. ** F > M *** H > W, B National Youth Risk Behavior Survey, 2007
Percentage of High School Students Who Vomited or Took Laxatives to Lose Weight or to Keep From Gaining Weight,* by Sex** and Race/Ethnicity,*** 2007 * During the 30 days before the survey. ** F > M*** H > B National Youth Risk Behavior Survey, 2007
Percentage of High School Students Who Vomited or Took Laxatives to Lose Weight or to Keep From Gaining Weight,* 1995 – 2007 * During the 30 days before the survey. 1 No change 1995-2003, decreased 2003-2007, p < .05 National Youth Risk Behavior Surveys, 1995 – 2007
Continuing Survey of Food Intake by Individuals (CSFII) • USDA • 1994-1996 • in-person interviews • 24-hour dietary recall: 2 nonconsecutive days of food intake data collected 3-10 days apart • 2 weeks later, one adult from each household asked questions about knowledge and attitudes toward dietary guidance, health, and use of food labels.
CFSII - Sample • Nationally representative stratified multistage area probability sample of U.S. noninstitutionalized civilian population, all ages. • Oversampling of low-income households • For 1994–96, sample size for 1-day dietary data was 16,103; for 2-day dietary data, it was 15,303.
CFSII - Data • kinds and amounts of foods consumed • sources of foods • time, name of each eating occasion • food expenditures, shopping practices • pregnancy, lactation, nursing status, • height and weight • income, poverty status, household size, • participation in Food Stamp and WIC programs
CFSII - Data Availability • National; four U.S. Census Bureau regions; Standard Metropolitan Statistical Areas • http://www.barc.usda.gov/bhnrc/foodsurvey/home.htm