Download
1 / 9
90 likes | 220 Vues
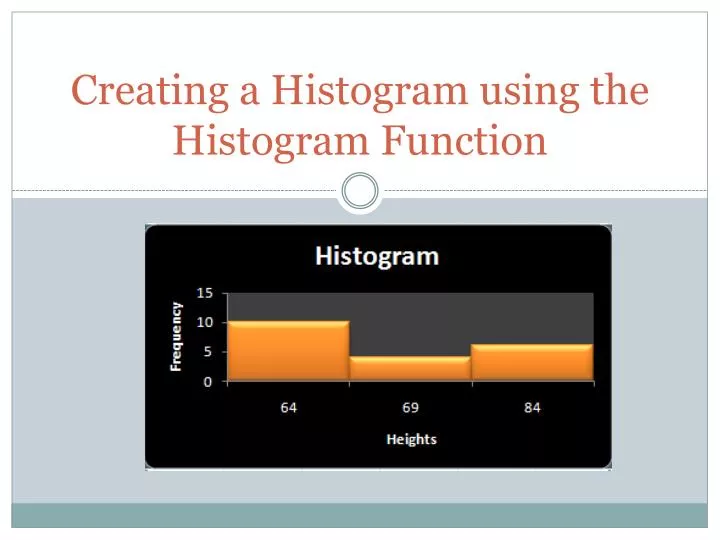
Creating a Histogram using the Histogram Function. Create a column of bins. In any cell in the Excel spreadsheet type 64, 69, 74 (or any bins you choose). Create the chart. Data Data Analysis Histogram. Histogram Function. Input Range highlight the height data

E N D
Create a column of bins • In any cell in the Excel spreadsheet • type 64, 69, 74 (or any bins you choose)
Create the chart • Data Data Analysis Histogram
Histogram Function • Input Range highlight the height data • Bin Range Highlight the created column of bins • Check chart output • Output Range specify any cells in the Excel spreadsheet
Close the gap width in the Histogram • Right click on a bar in the chart Format Data Series
Histogram Function Close the gap width to 0%
Chart colors • Chart Tools Design change colors
Delete the “more” bar • Highlight the cells in the frequency distribution • Delete
Axes Titles • Click on the word “Bin” and type “Heights” enter