Download
1 / 11
110 likes | 195 Vues
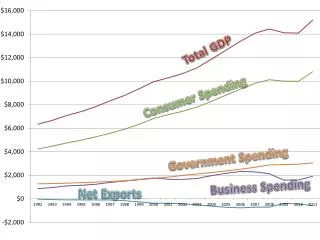
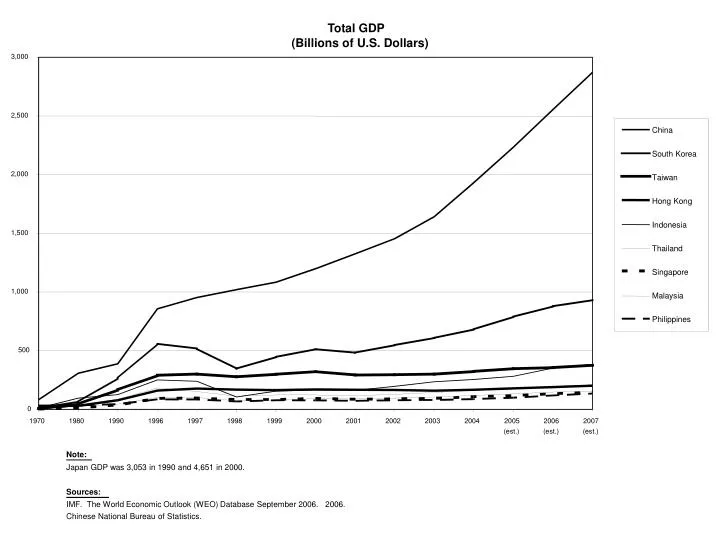
Total GDP . (Billions of U.S. Dollars). 3,000. 2,500. China. South Korea. 2,000. Taiwan. Hong Kong. Indonesia. 1,500. Thailand. Singapore. 1,000. Malaysia. Philippines. 500. 0. 1970. 1980. 1990. 1996. 1997. 1998. 1999. 2000. 2001. 2002. 2003. 2004. 2005. 2006. 2007.

E N D
Total GDP (Billions of U.S. Dollars) 3,000 2,500 China South Korea 2,000 Taiwan Hong Kong Indonesia 1,500 Thailand Singapore 1,000 Malaysia Philippines 500 0 1970 1980 1990 1996 1997 1998 1999 2000 2001 2002 2003 2004 2005 2006 2007 (est.) (est.) (est.) Note: Japan GDP was 3,053 in 1990 and 4,651 in 2000. Sources: IMF. The World Economic Outlook (WEO) Database September 2006. 2006. Chinese National Bureau of Statistics.
The Double Dip Recession in Asia Real GDP Growth (Annual Percent Change) 15 10 China 5 Hong Kong South Korea Singapore Malaysia 0 Taiwan Thailand Philippines Indonesia Japan -5 -10 -15 1996 1997 1998 1999 2000 2001 2002 2003 2004 2005 (est.) 2006 (est.) 2007 (est.) Source: IMF. The World Economic Outlook (WEO) Database September 2006. 2006.
Is the slowdown of Pac Rim growth temporary or a long-term trend? Key economies undergoing restructuring: - Japan - South Korea - Taiwan - Indonesia
Impact on economic alignments: - Shifting trade linkages: soaring intra-Asian trade - Investment patterns: flows into and out of Asia - R & D / Royalties: growing scientific strength in Asia
Inflows of Foreign Direct Investment (Billions of U.S. Dollars) 80 70 60 China 50 Hong Kong Singapore Malaysia 40 Indonesia India Philippines 30 Japan Taiwan 20 Thailand Pakistan South Korea 10 0 -10 1990 1991 1992 1993 1994 1995 1996 1997 1998 1999 2000 2001 2002 2003 2004 2005 Source: UNCTAD. On-line Handbook of Statistics
Effects on Regional Institutions: - APEC - ASEAN - ASEAN + 3 - Shanghai 6 - Chiang Mai Initiative - East Asian Summit
Effects on Strategic Linkages: • Options for guarantor: • U.S. / Japan / India • China • U.S. • India