Download
1 / 13
130 likes | 201 Vues
Automatic Analysis of Edge Pedestal Gradient Degradation during ELMs. S. González, J. Vega, A. Murari, A. Pereira and JET-EFDA contributors 7 th Workshop on Fusion Data Processing, Validation and Analysis, March 2012. Introduction (I). H-mode features [1]: Improved particle confinement

E N D
Automatic Analysis of Edge Pedestal Gradient Degradation during ELMs S. González, J. Vega, A. Murari, A. Pereira and JET-EFDA contributors 7th Workshop on Fusion Data Processing, Validation and Analysis, March 2012
Introduction (I) • H-mode features [1]: • Improved particle confinement • Existence of an External Transport Barrier (ETB) • Existence of Edge Localised Modes (ELMs) [1] F. Wagner et al., Regime of improved confinement and high beta in neutral-beam-heated divertor discharges of the ASDEX tokamak, Physical Review Letters 49 (19), pages 1408-1412, 1982
Introduction (II) • ELMs [2]: • Instabilities at the plasma edge • H-mode plasmas • At each burst: • The ETB is reduced • The plasma confinement degrades • Quantify the edge pedestal gradient degradation during ELMs [2] H. Zohm, Edge localized modes (ELMs), Plasma Physics and Controlled Fusion 38, pages 105-128, 1996
Edge Pedestal Gradient (I): ELMs location • ELMs location [3]: • UMEL [4] • Dα peaks • Diamagnetic energy drops • Automatic [3] S. González, J. Vega, A. Murari, A. Pereira, M. Beurskens and JET-EDA contributors, Automatic ELM location in JET using a Universal Multi-Event Locator, Fusion Science and Technology 58 (3), pages 755-762, 2010 [4] J. Vega, A. Murari, S. González and JET-EFDA contributors, A universal supprt vector machines based method for automatic event location in waveforms and video-movies: applications to massive nuclear fusion databases, Review of Scientific Instruments 81, 023505, 2010
Edge Pedestal Gradient (II): ET, SGT and SGB • At each instant, two signals are considered: • Electron Temperature (ET) profile • Steep Gradient Temperature (SGT): difference of temperature between two consecutive radial points of ET • Steep Gradient Baseline (SGB): mean value of the SGT between the plasma core and the ETB
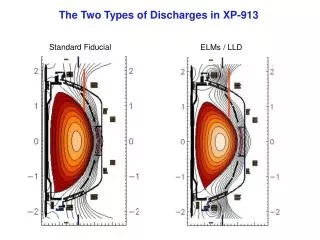
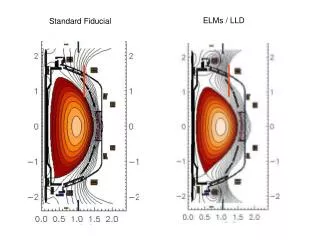
Edge Pedestal Gradient (III): ET, SGT and SGB • JET pulse 78072: L & H temperature profiles comparison a) b)
Edge Pedestal Gradient (IV): ELMs analysis SGTETB • For each ELM burst: • SGT is compared at two different times: • At the ELM time (ELM) • 2 ms before (ELM-0.002) • SGT is measure at the ETB • At the ELM time (SGTETBELM ) • 2 ms before ( SGTETBELM-0.002)
Edge pedestal gradient (V): degradation SGTETBELM-0.002 SGTETBELM ELM ELM-0.002
Edge Pedestal Gradient (VI): example SGTETBELM-0.002 SGTETBELM ELM ELM-0.002
Results (I) • Edge Pedestal Gradient degradation results: • # pulses analysed: 409 • # ELMs analysed: 22486 • Edge pedestal gradient degradation mean value: 33.98% • # ELMs, degradation higher than 80%: 924, 4.11% • # ELMs, degradation higher than 90%: 291 1.29%
Edge Pedestal Gradient (VII): evolution • Edge Pedestal Gradient 2ms after the ELM • Pulse 789072, time = 8.9951 s Mean degradation: 17.34 %
Results (II) • Distribution of the edge pedestal gradient degradation of analysed ELMs Degradation between ELM time -0.002 and ELM time+0.002 Mean Value: 17.34% (degradation = 0 not shown, 6380 ELMs) Degradation between ELM time -0.002 and ELM time Mean Value: 33.98%
Questions • Thank you very much for your attention • Questions?