Download
1 / 49
490 likes | 689 Vues
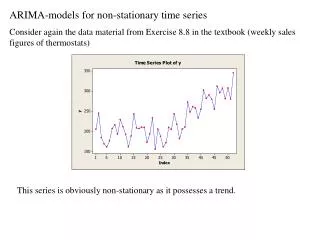
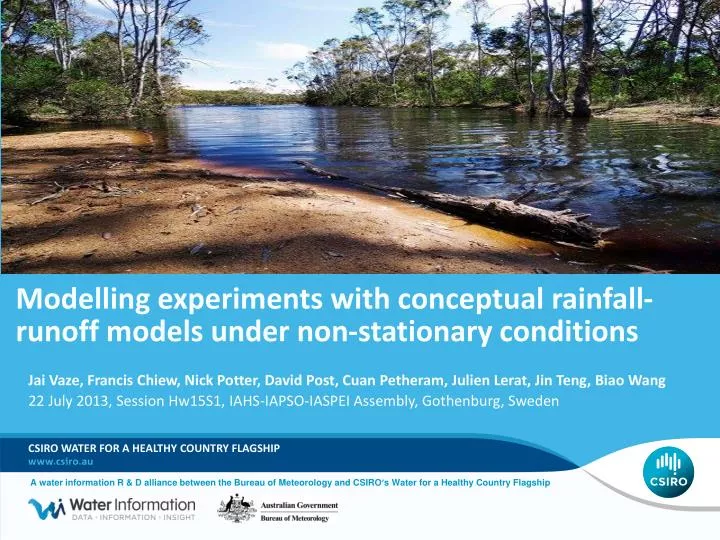
Modelling experiments with conceptual rainfall-runoff models under non-stationary conditions. CSIRO Water for a healthy country flagship. Jai Vaze, Francis Chiew, Nick Potter, David Post, Cuan Petheram, Julien Lerat, Jin Teng, Biao Wang.

E N D
Modelling experiments with conceptual rainfall-runoff models under non-stationary conditions CSIRO Water for a healthy country flagship Jai Vaze, Francis Chiew, Nick Potter, David Post, Cuan Petheram, Julien Lerat, Jin Teng, Biao Wang 22 July 2013, Session Hw15S1, IAHS-IAPSO-IASPEI Assembly, Gothenburg, Sweden A water information R & D alliance between the Bureau of Meteorology and CSIRO’s Water for a Healthy Country Flagship
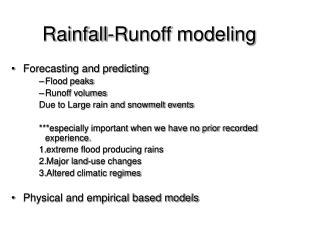
Background • Number of recent studies investigating/highlighting hydro-climate nonstationarity Evaluation criteria • Level 1 • Calibrate the hydrological model using complete period • Calculate the efficiency criteria (NSE, bias, NSEiQ) for each of the 5 sub-periods • Level 2 • Calibrate the hydrological model using each of the 5 sub-periods • Calculate the efficiency criteria (NSE, bias, NSEiQ) for the complete period as well as each of the 5 sub-periods • Level 3 • Improvement of model behaviour/performance in non-stationary conditions Objective function: NSE-bias of daily streamflow
Data and Models • Modelling experiments using data from seven catchment • Axe Creek (Aus) • Durance (France) • Ferson (USA) • Flinders (Aus) • Gilbert (Aus) • Kamp-zwettl (Austria) • Lissbro (Sweden) • Six conceptual daily rainfall-runoff models • Sacramento (14) • SIMHYD (7) • GR4J (4) • AWBM (6) • SMARG (8) • IHACRES (7)
Changes in dominant hydrological processes(during long dry spells) [Petheram et al., MODSIM, 2011] Axe Creek catchment • Changing rainfall-runoff relationship. • Interception activities (like farm dams) intercepting proportionally more water during long dry spells. • Reduced surface water and groundwater connectivity during long dry spells. • Most rainfall filling the empty groundwater store post 1997. IAHS Gothenburg HW15S1 | Jai Vaze |
[Vaze et al., 2010, Journal of Hydrology] Axe Creek catchment – GR4J P=5143, Q=722 P=4199, Q=473 P=4867, Q=552 P=3872, Q=258 P=3318, Q=35 Catchment area = 236.9 km2 Very low discharge during the period 1997-2008 ('Millennium Drought') due to low annual rainfall, 'changed' rainfall characteristics and higher T. 1973-1979 1980-1986 1987-1993 1994-2000 2001-2007 p2 p3 p4 p5 p1 Rc=0.14 Rc=0.11 Rc=0.11 Rc=0.07 Rc=0.01 Complete NSE Bias NSEiQ
Catchment area = 134 km2 Growing urbanisation of the catchment: 1980 ~22% to 2010 ~ 64% Ferson catchment - AWBM p2 p3 p4 p5 p1 Complete NSE Bias NSEiQ
Catchment area = 134 km2 Growing urbanisation of the catchment: 1980 ~22% to 2010 ~ 64% Ferson catchment – GR4J p2 p3 p4 p5 p1 Complete NSE Bias NSEiQ
Catchment area = 134 km2 Growing urbanisation of the catchment: 1980 ~22% to 2010 ~ 64% Ferson catchment – IHACRES p2 p3 p4 p5 p1 Complete NSE Bias NSEiQ
Catchment area = 134 km2 Growing urbanisation of the catchment: 1980 ~22% to 2010 ~ 64% Ferson catchment – Sacramento p2 p3 p4 p5 p1 Complete NSE Bias NSEiQ
Catchment area = 134 km2 Growing urbanisation of the catchment: 1980 ~22% to 2010 ~ 64% Ferson catchment – Simhyd p2 p3 p4 p5 p1 Complete NSE Bias NSEiQ
Catchment area = 134 km2 Growing urbanisation of the catchment: 1980 ~22% to 2010 ~ 64% Ferson catchment – SMARG p2 p3 p4 p5 p1 Complete NSE Bias NSEiQ
Catchment area = 236.9 km2 Very low discharge during the period 1997-2008 ('Millennium Drought') due to low annual rainfall, 'changed' rainfall characteristics and higher T. Axe Creek catchment - AWBM p2 p3 p4 p5 p1 Complete NSE Bias NSEiQ
Catchment area = 236.9 km2 Very low discharge during the period 1997-2008 ('Millennium Drought') due to low annual rainfall, 'changed' rainfall characteristics and higher T. Axe Creek catchment – GR4J p2 p3 p4 p5 p1 Complete NSE Bias NSEiQ
Catchment area = 236.9 km2 Very low discharge during the period 1997-2008 ('Millennium Drought') due to low annual rainfall, 'changed' rainfall characteristics and higher T. Axe Creek catchment - IHACRES p2 p3 p4 p5 p1 Complete NSE Bias NSEiQ
Catchment area = 236.9 km2 Very low discharge during the period 1997-2008 ('Millennium Drought') due to low annual rainfall, 'changed' rainfall characteristics and higher T. Axe Creek catchment - Sacramento p2 p3 p4 p5 p1 Complete NSE Bias NSEiQ
Catchment area = 236.9 km2 Very low discharge during the period 1997-2008 ('Millennium Drought') due to low annual rainfall, 'changed' rainfall characteristics and higher T. Axe Creek catchment - Simhyd p2 p3 p4 p5 p1 Complete NSE Bias NSEiQ
Catchment area = 236.9 km2 Very low discharge during the period 1997-2008 ('Millennium Drought') due to low annual rainfall, 'changed' rainfall characteristics and higher T. Axe Creek catchment - SMARG p2 p3 p4 p5 p1 Complete NSE Bias NSEiQ
Catchment area = 2170 km2 Temperature increase implying a diminution of glaciers Durance catchment - AWBM p2 p3 p4 p5 p1 Complete NSE Bias NSEiQ
Catchment area = 2170 km2 Temperature increase implying a diminution of glaciers Durance catchment – GR4J p2 p3 p4 p5 p1 Complete NSE Bias NSEiQ
Catchment area = 2170 km2 Temperature increase implying a diminution of glaciers Durance catchment - IHACRES p2 p3 p4 p5 p1 Complete NSE Bias NSEiQ
Catchment area = 2170 km2 Temperature increase implying a diminution of glaciers Durance catchment - Sacramento p2 p3 p4 p5 p1 Complete NSE Bias NSEiQ
Catchment area = 2170 km2 Temperature increase implying a diminution of glaciers Durance catchment - Simhyd p2 p3 p4 p5 p1 Complete NSE Bias NSEiQ
Catchment area = 2170 km2 Temperature increase implying a diminution of glaciers Durance catchment - SMARG p2 p3 p4 p5 p1 Complete NSE Bias NSEiQ
Catchment area = 1912 km2 The analysis of non-stationarity in this catchment is complicated by the high inter-annual variability and the intermittency of the flow regime. Flinders catchment - AWBM p2 p3 p4 p5 p1 Complete NSE Bias NSEiQ
Catchment area = 1912 km2 The analysis of non-stationarity in this catchment is complicated by the high inter-annual variability and the intermittency of the flow regime. Flinders catchment – GR4J p2 p3 p4 p5 p1 Complete NSE Bias NSEiQ
Catchment area = 1912 km2 The analysis of non-stationarity in this catchment is complicated by the high inter-annual variability and the intermittency of the flow regime. Flinders catchment - IHACRES p2 p3 p4 p5 p1 Complete NSE Bias NSEiQ
Catchment area = 1912 km2 The analysis of non-stationarity in this catchment is complicated by the high inter-annual variability and the intermittency of the flow regime. Flinders catchment - Sacramento p2 p3 p4 p5 p1 Complete NSE Bias NSEiQ
Catchment area = 1912 km2 The analysis of non-stationarity in this catchment is complicated by the high inter-annual variability and the intermittency of the flow regime. Flinders catchment - Simhyd p2 p3 p4 p5 p1 Complete NSE Bias NSEiQ
Catchment area = 1912 km2 The analysis of non-stationarity in this catchment is complicated by the high inter-annual variability and the intermittency of the flow regime. Flinders catchment - SMARG p2 p3 p4 p5 p1 Complete NSE Bias NSEiQ
Catchment area = 1906.5 km2 The analysis of non-stationarity in this catchment is complicated by the high inter-annual variability and the intermittency of the flow regime. Gilbert catchment - AWBM p2 p3 p4 p5 p1 Complete NSE Bias NSEiQ
Catchment area = 1906.5 km2 The analysis of non-stationarity in this catchment is complicated by the high inter-annual variability and the intermittency of the flow regime. Gilbert catchment – GR4J p2 p3 p4 p5 p1 Complete NSE Bias NSEiQ
Catchment area = 1906.5 km2 The analysis of non-stationarity in this catchment is complicated by the high inter-annual variability and the intermittency of the flow regime. Gilbert catchment - IHACRES p2 p3 p4 p5 p1 Complete NSE Bias NSEiQ
Catchment area = 1906.5 km2 The analysis of non-stationarity in this catchment is complicated by the high inter-annual variability and the intermittency of the flow regime. Gilbert catchment - Sacramento p2 p3 p4 p5 p1 Complete NSE Bias NSEiQ
Catchment area = 1906.5 km2 The analysis of non-stationarity in this catchment is complicated by the high inter-annual variability and the intermittency of the flow regime. Gilbert catchment - Simhyd p2 p3 p4 p5 p1 Complete NSE Bias NSEiQ
Catchment area = 1906.5 km2 The analysis of non-stationarity in this catchment is complicated by the high inter-annual variability and the intermittency of the flow regime. Gilbert catchment - SMARG p2 p3 p4 p5 p1 Complete NSE Bias NSEiQ
Catchment area = 621.8 km2 increase in air temperature (i.e. mean air temp in 1976-86 is approximately 6.0C, in the period 1998-2008 it is 7.3°C), plus dramatic floods in August 2002. Kamp-Zwettl catchment - AWBM p2 p3 p4 p5 p1 Complete NSE Bias NSEiQ
Catchment area = 621.8 km2 increase in air temperature (i.e. mean air temp in 1976-86 is approximately 6.0C, in the period 1998-2008 it is 7.3°C), plus dramatic floods in August 2002. Kamp-Zwettl catchment – GR4J p2 p3 p4 p5 p1 Complete NSE Bias NSEiQ
Catchment area = 621.8 km2 increase in air temperature (i.e. mean air temp in 1976-86 is approximately 6.0C, in the period 1998-2008 it is 7.3°C), plus dramatic floods in August 2002. Kamp-Zwettl catchment - IHACRES p2 p3 p4 p5 p1 Complete NSE Bias NSEiQ
Catchment area = 621.8 km2 increase in air temperature (i.e. mean air temp in 1976-86 is approximately 6.0C, in the period 1998-2008 it is 7.3°C), plus dramatic floods in August 2002. Kamp-Zwettl catchment - Sacramento p2 p3 p4 p5 p1 Complete NSE Bias NSEiQ
Catchment area = 621.8 km2 increase in air temperature (i.e. mean air temp in 1976-86 is approximately 6.0C, in the period 1998-2008 it is 7.3°C), plus dramatic floods in August 2002. Kamp-Zwettl catchment - Simhyd p2 p3 p4 p5 p1 Complete NSE Bias NSEiQ
Catchment area = 621.8 km2 increase in air temperature (i.e. mean air temp in 1976-86 is approximately 6.0C, in the period 1998-2008 it is 7.3°C), plus dramatic floods in August 2002. Kamp-Zwettl catchment - SMARG p2 p3 p4 p5 p1 Complete NSE Bias NSEiQ
Catchment area = 97 km2 In January 2005, a severe storm (called Gudrun) in southern Sweden, lead to considerable loss of forest/deforestation in some basins including this one. There was a lot of speculation on the increased risk for flooding in the area following this change. Lissbro catchment - AWBM p2 p3 p4 p5 p1 Complete NSE Bias NSEiQ
Catchment area = 97 km2 In January 2005, a severe storm (called Gudrun) in southern Sweden, lead to considerable loss of forest/deforestation in some basins including this one. There was a lot of speculation on the increased risk for flooding in the area following this change. Lissbro catchment – GR4J p2 p3 p4 p5 p1 Complete NSE Bias NSEiQ
Catchment area = 97 km2 In January 2005, a severe storm (called Gudrun) in southern Sweden, lead to considerable loss of forest/deforestation in some basins including this one. There was a lot of speculation on the increased risk for flooding in the area following this change. Lissbro catchment - IHACRES p2 p3 p4 p5 p1 Complete NSE Bias NSEiQ
Catchment area = 97 km2 In January 2005, a severe storm (called Gudrun) in southern Sweden, lead to considerable loss of forest/deforestation in some basins including this one. There was a lot of speculation on the increased risk for flooding in the area following this change. Lissbro catchment - Sacramento p2 p3 p4 p5 p1 Complete NSE Bias NSEiQ
Catchment area = 97 km2 In January 2005, a severe storm (called Gudrun) in southern Sweden, lead to considerable loss of forest/deforestation in some basins including this one. There was a lot of speculation on the increased risk for flooding in the area following this change. Lissbro catchment - Simhyd p2 p3 p4 p5 p1 Complete NSE Bias NSEiQ
Catchment area = 97 km2 In January 2005, a severe storm (called Gudrun) in southern Sweden, lead to considerable loss of forest/deforestation in some basins including this one. There was a lot of speculation on the increased risk for flooding in the area following this change. Lissbro catchment - SMARG p2 p3 p4 p5 p1 Complete NSE Bias NSEiQ
Summary • Which catchments are easier to model and which are hard • Ferson (USA), Kamp-zwettl (Austria), Axe Creek (Aus), Lissbro (Sweden) • What can be the reason and what’s the way to overcome this • Durance (France) • Flinders (Aus) • Gilbert (Aus)
Thankyou • Jai VazePrincipal Research Scientist • CSIRO Land and Water • t +61 2 6246 5871 • E Jai.Vaze@csiro.au • w http://www.csiro.au/people/Jai.Vaze.html CSIRO Land and water A water information R & D alliance between the Bureau of Meteorology and CSIRO’s Water for a Healthy Country Flagship