Download
1 / 17
170 likes | 289 Vues
Grid enabling legacy applications for scalability Experiences of a production grid on the UK NGS. Anjan Pakhira Ronald Fowler, Lakshmi Sastry and Toby Perring CCLRC Rutherford Appleton Laboratory. Presentation Overview. Introduction Development of parallel fitting software on NGS

E N D
Grid enabling legacy applications for scalability Experiences of a production grid on the UK NGS Anjan Pakhira Ronald Fowler, Lakshmi Sastry and Toby Perring CCLRC Rutherford Appleton Laboratory
Presentation Overview • Introduction • Development of parallel fitting software on NGS • Client in Matlab use of JAVA SWING over MATLAB GUIDE • Interface to Globus via the GEODISE toolbox • Use of SRB • Concluding remarks
Introduction CCLRC is home to large scale research facilities • Produces gigabytes of data per experiment, through observations and simulations • Data size and complexity of simulations set to increase by several orders with next generation facilities DIAMOND and TS2 Challenges for moving to the Grid • Availability of proven analysis applications • Scientists familiarity with applications and desktop tools • Reduce complexity of Grid Computing APIs
Introduction (Continued) • e-Science and Grid Computing can succeed only if • robust, proven applications are available on the Grid • Scalability and productivity is demonstrably improved • A friendly and familiar interface to the grid is provided • eVe – e-Science Visualization Environment aims to support the above by • using exemplar applications, • building common data structures for detector science • building advanced visualization on the grid to link to the simulations and applications on the grid • incremental functionality to desktop (Matlab, IDL) • Familiar user interfaces
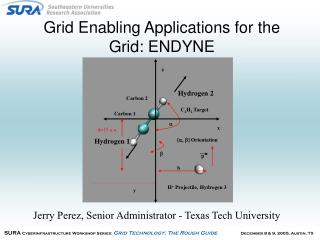
MAPS spectrometer • Raw data: • - 40,000 detector elements • - 2500 time channels • 108 pixels 0.4GB datasets • Data three-dimensional: • - time-of-arrival • - 2 coordinates on the detector array • Physics four dimensional: • three component of Q • energy transfer Background chopper Position sensitive detector array
Application - Data treatment - Outline Data correction: “Homer” Raw data files (108 pixels 0.4GB each) – every 10-20 hours Corrected data files (107 pixels 0.2GB each) • Visualisation: “MSLICE” • transform to physics variables (Q, ) • data gathered on 3D manifold in 4D space of interest -1D cuts from the data (100kB to 10MB – but hundreds of them) -2D slices (~10MB – but dozens of them) • Quantitative analysis: “Tobyfit” • simultaneous fitting of a selection of the data • user supplied models
Why TobyFit needs the Grid • Present instrumentation: (MAPS, MARI, HET) • fit full data sets • real time • 60hrs for single dataset (3 free parameters, 2 = 0.1) • speed-up on 64 processor node: @ 50 • NOT a ‘demonstration’ project: real use on the instrument • user community MAPS: in past 4 years 60 experiments, 25 groups • Future instrumentation (MERLIN, LET): • Makes full data fitting achievable goal • New class of experiments, wider community of users • RISK (if not implemented): • minimal exploitation of instruments
Development of parallel fitting software • Tobyfit code features • FORTRAN 77, over 300 subroutines, 31K lines of code. • Is command line driven, used for interactive fitting of multiple data sets • A customized non-linear least squares code - Monte Carlo integration, amongst other methods. • User and background functions with varying numbers of parameters • All memory is statically allocated. • Parallel development • Chose MPI and Fortran 90 to target NGS clusters and for code reuse • Two prototypes • Task farming, partitioning spectra • Data partitioning across spectra. • Parallel development done on NGS and local machines. • LF95 used as better debugging compiler than pgf90 • Memory use a problem, as still using static allocation, but now able to fit multiple 3D data files simultaneously
Cont.. • Performance of the parallel implementation • Near linear speed up has been achieved for 1-D and 2-D datasets, presently looking at 3-D datasets to achieve similar performance. • The code can handle multiple full 3D datasets, which has hitherto not been possible. • Most of code unaltered so scientist can continue to integrate new developments to software.
User interface using Java Swing within Matlab • Matlab was the user chosen PSE for the client development. • Advantages: • Ease of integration of user’s other analysis tools which were Matlab based. • Availability of grid toolbox like Geodise. • Extensively used by ISIS scientists • Disadvantages • Matlab’s UI development tool, GUIDE was found to be inflexible and not rich in features we required. • Matlab not ideal language for user interface development • Matlab allows only limited interaction with Java classes.
Cont.. • Job Management • The client has a management scheme to launch and track multiple grid jobs simultaneously on different resources • The dataflow control is client centric, i.e. the client manages all interactions with the server and data store (SRB), through a series of bookkeeping actions in the background. • The reason choosing to implement this scheme stems from the fact that the user may not only launch multiple jobs of the mainly two different types, model simulation and fitting, but also may choose that result from one job as the input for subsequent jobs. • History • The ability of the user to retrieve a particular session, along with all data used was a key requirement, the client implements this feature by saving session state for future use.
Use of Geodise Compute Toolbox • Geodise Toolbox • The client uses Geodise toolbox,which is a higher level layer for CoGkit with Matlab wrappers. • Experience of using Geodise • The use of this toolbox has been a largely positive experience. • We have found certain performance issues with the gridFTP component, which we believe are caused due to site firewall settings. • The performance issues are mostly related to unusually long timeouts. • The error messages could have been more helpful.
Data management and SRB • SRB has been used to implement all data management functionality of the software. • The incompatibility between different SRB versions is a cause for concern. • The use of SRB has been through the Scommand interface. • We found jargon difficult to use and incomplete. • Scommands do seem to function reasonably well on Linux but the windows interface did not always work as documented. In particular we found the SRSYNC command to fail with segmentation errors.
Concluding remarks • As part of the eVe project an important legacy application has been parallelised and provided with a user friendly interface to grid resources from Matlab. • As a result routine data analysis of much larger datasets is now possible. • Use of Matlab has increased the ease with which scientists will take this up. We have received very encouraging feedback from scientific users. • Geodise compute toolbox provided a flexible and easy to use interface. Acknowledgements: • We would like to thank the NGS team for their support. • The Geodise project for use of the compute toolbox. • DTI for the funding this project.
Issues eVe will address • Analyse only a small fraction of the data at present • Sheer number crunching required by TOBYFIT • - New experimental procedures • present: 20 hour data collection @ 10 runs • starting to use: 2 hour collection @ 100 runs 20GB+ • 3D manifold full mapping in 4 dimensions • runs to be visualised and analysed collectively • real-time during experiment • New instruments: MERLIN [October 2005 !!], LET [2007] • up to 10 times the count rate • a 4D data set, size 20GB, every day • volume of data that must be sliced-and-diced and analysed • data management
eVe (Continued) Visualisation (MSLICE++) • 20GB datasets in 4 independent coordinates Qh, Qk, Ql, • Not possible to visualise on a single processor machine • Need to slice-and-dice (3D, 2D, 1D) in real time • Opportunities • Areas of sciences not presently studied in crystals at ISIS • any system with interactions in 3 dimensions • lattice vibrations, diffuse scattering & magnetic interactions in complex materials • But with comprehensive survey • REAL user tool • RISK: • Effective operation of MERLIN and LET will rely on advanced visualisation • Lost opportunity to open up new areas of science