Download
1 / 13
130 likes | 308 Vues
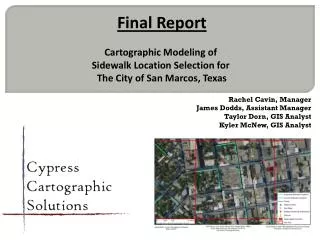
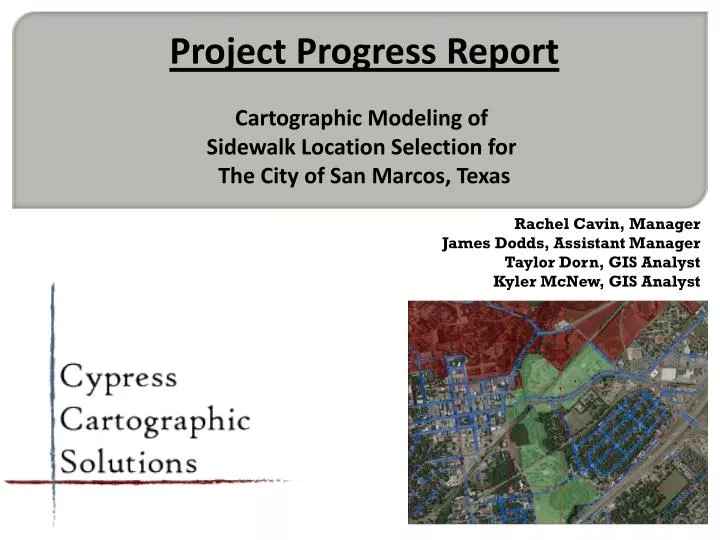
Project Progress Report Cartographic Modeling of Sidewalk Location Selection for The City of San Marcos, Texas. Rachel Cavin , Manager James Dodds , Assistant Manager Taylor Dorn, GIS Analyst Kyler McNew , GIS Analyst. Project Description.

E N D
Project Progress Report Cartographic Modeling of Sidewalk Location Selection for The City of San Marcos, Texas Rachel Cavin, Manager James Dodds, Assistant Manager Taylor Dorn, GIS Analyst KylerMcNew, GIS Analyst
Project Description Our purpose is to develop a GIS model to select locations in need of pedestrian infrastructure improvements within San Marcos, Texas. The selection process is based off on location of pedestrian traffic generators throughout San Marcos, such as schools, retail centers, and parks.
New Methodology Divide city limits into ¼ mile grid cells. Score each grid cell by pedestrian traffic generators and length of sidewalks contained. Compare highest scored cells to aerial imagery. Select areas in need of sidewalks (Subjective)
Project Progress Example Our grid system is made up of ¼ square mile cells through San Marcos city limits. Pedestrian traffic generators will fall within each cell, contributing to the score of the cell. Length of sidewalks in the cell will also be considered in cell scores.
Project Progress Example Within the selected high scoring cells, we will analyze facilities, gaps, and our aerial photograph to make recommendations on areas in high need of pedestrian infrastructure for facility access and network connectivity.
Completed Work • Literature review • Data collection • Initial data from The City of San Marcos • Layer creation (Low income housing, Bobcat Tram and CARTS bus routes, trailheads, & pedestrian traffic generators) • Aerial imagery • Data processing • Classification of pedestrian traffic generators • Methodology change • Use of grid system instead of inverse sidewalk layer
Work In Progress • Data analysis • We are currently planning and developing our model to locate areas of the city that are ranked highest for pedestrian traffic.
Future Work Select high scoring cells above a threshold as sidewalk development focus areas. Locate segments in need of sidewalks by comparing current sidewalk inventory to aerial imagery within the highest ranked cells. Generate metadata for all data created during our project. Create final deliverables for our client.
Time Schedule Phase 1: Data Collection (Completed) Phase 2: Data Processing (Completed) Phase 3: Data Analysis (In Progress) Phase 4: Data Interpretation (Future Work) February 20: Proposal Presentation (Completed) March 25: Progress Presentation (In Progress) May 3: Final Product Delivered (Future Work)
Problems • Our main issue was finalizing our methodology. • Decided on using a grid system • Eliminating subjectivity • Within the ranking of criteria • Accuracy of Google Earth • Points created and imported are not exactly accurate to their true locations • We have overcome all issues that have presented themselves
Final Deliverables • At the conclusion of our project, The City of San Marcos will receive the following: • Detailed Final Report (two copies) • Project Website • CD, two copies containing: • All data • Metadata • Proposal, Progress Report, and Final Report • Poster • PowerPoint Presentations • Instructions on how to use the CD (readme file) • A poster will be produced for the Texas State Geography Department.
Conclusion • We are on schedule. • Problems have been resolved. • Methodology has been improved. • May 3rddeadline will be met.
Any Questions? Thank you.